Chrysler 2005 Annual Report Download - page 100
Download and view the complete annual report
Please find page 100 of the 2005 Chrysler annual report below. You can navigate through the pages in the report by either clicking on the pages listed below, or by using the keyword search tool below to find specific information within the annual report.-
 1
1 -
2
-
3
-
4
-
5
-
6
-
7
-
8
-
9
-
10
-
11
-
12
-
13
-
14
-
15
-
16
-
17
-
18
-
19
-
20
-
21
-
22
-
23
-
24
-
25
-
26
-
27
-
28
-
29
-
30
-
31
-
32
-
33
-
34
-
35
-
36
-
37
-
38
-
39
-
40
-
41
-
42
-
43
-
44
-
45
-
46
-
47
-
48
-
49
-
50
-
51
-
52
-
53
-
54
-
55
-
56
-
57
-
58
-
59
-
60
-
61
-
62
-
63
-
64
-
65
-
66
-
67
-
68
-
69
-
70
-
71
-
72
-
73
-
74
-
75
-
76
-
77
-
78
-
79
-
80
-
81
-
82
-
83
-
84
-
85
-
86
-
87
-
88
-
89
-
 90
90 -
 91
91 -
 92
92 -
 93
93 -
 94
94 -
 95
95 -
 96
96 -
 97
97 -
 98
98 -
 99
99 -
 100
100 -
 101
101 -
 102
102 -
 103
103 -
 104
104 -
 105
105 -
 106
106 -
 107
107 -
 108
108 -
 109
109 -
 110
110 -
111
-
112
-
113
-
114
-
115
-
116
-
117
-
118
-
119
-
120
-
121
-
122
-
123
-
124
-
125
-
126
-
127
-
128
-
129
-
130
-
131
-
132
-
133
-
134
-
135
-
136
-
137
-
138
-
139
-
140
-
141
-
142
-
143
-
144
-
145
-
146
-
147
-
148
-
149
-
150
-
151
-
152
-
153
-
154
-
155
-
156
-
157
-
158
-
159
-
160
-
161
-
162
-
163
-
164
-
165
-
166
-
167
-
168
-
169
-
170
-
171
-
172
-
173
-
174
-
175
-
176
-
177
-
178
-
179
-
180
-
181
-
182
-
183
-
184
-
185
-
186
-
187
-
188
-
189
-
190
-
191
-
192
-
193
-
194
-
195
-
196
-
197
-
198
-
199
-
200
-
201
-
202
-
203
-
204
-
205
-
206
-
207
-
208
-
209
-
210
-
211
-
212
-
213
-
214
-
215
-
216
-
217
-
218
-
219
-
220
-
221
-
222
-
223
-
224
-
225
-
226
-
227
-
228
-
229
-
230
-
231
-
232
-
233
-
234
-
235
-
236
-
237
-
238
-
239
-
240
-
241
-
242
-
243
-
244
-
245
-
246
-
247
-
248
-
249
-
250
-
251
-
252
-
253
-
254
-
255
-
256
-
257
-
258
-
259
-
260
-
261
-
262
-
263
-
264
-
265
-
266
-
267
-
268
-
269
-
270
-
271
-
272
-
273
-
274
-
275
-
276
-
277
-
278
 |
 |

99
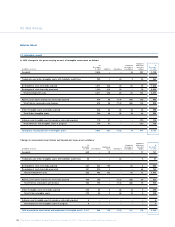
Fiat Group Consolidated Financial Statements at December 31, 2005 - N otes to the Consolidated Financial Statements
In order to render the reconciliation between income taxes recorded in the financial statements and theoretical income taxes more
meaningful, the IRAP tax is not taken into consideration. Since the IRAP tax has a taxable basis that is different from income before taxes,
it generates distortions between one year and another. Accordingly, theoretical income taxes are determined by applying only the IRES tax
rate (equal to 33% in 2005) in effect in Italy to income before taxes.
Permanent differences in the above reconciliation include the tax effect of non-taxable income of 677 million euros in 2005 (229 million euros
in 2004) and of non-deductible costs of 225 million euros in 2005 (232 million euros in 2004). In particular, the tax effect of permanent
differences arises principally from the theoretical tax effect of 283 million euros on the unusual financial income relating to the Mandatory
Convertible Facility (gross 858 million euros) and that of 290 million euros arising from the sale of Italenergia Bis S.p.A. (gross 878
million euros).
In 2005, O ther differences included unrecoverable withholding tax for 21 million euros (11 million euros in 2004).
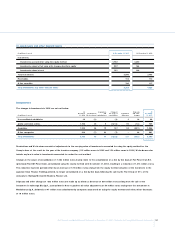
Current tax assets and liabilities in the balance sheet at December 31, 2005 amount to 778 million euros and 388 million euros, respectively
(780 million euros and 334 million euros at D ecember 31, 2004), as described in N otes 19 and 30.
N et deferred tax assets at D ecember 31, 2005 consist of deferred tax assets, net of deferred tax liabilities, that have been offset where
possible by the individual consolidated companies.The net balance of D eferred tax assets and D eferred tax liabilities may be analysed as
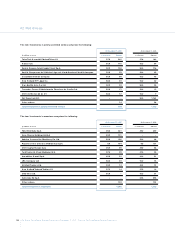
follows:
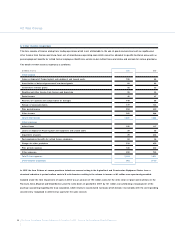
At At
December December
(in millions of euros) 31, 2005 31, 2004 Change
Deferred tax assets 2,104 2,402 (298)
Deferred tax liabilities (405) (522) 117
N et deferred tax assets 1,699 1,880 (181)
The reduction in net deferred tax assets is mainly due to the above-mentioned realisation of 277 million euros in deferred tax assets related to
the gain on the termination of the Master Agreement with General Motors.