Chrysler 2005 Annual Report Download - page 38
Download and view the complete annual report
Please find page 38 of the 2005 Chrysler annual report below. You can navigate through the pages in the report by either clicking on the pages listed below, or by using the keyword search tool below to find specific information within the annual report.-
 1
1 -
2
-
3
-
4
-
5
-
6
-
7
-
8
-
9
-
10
-
11
-
12
-
13
-
14
-
15
-
16
-
17
-
18
-
19
-
20
-
21
-
22
-
23
-
24
-
25
-
26
-
27
-
 28
28 -
 29
29 -
 30
30 -
 31
31 -
 32
32 -
 33
33 -
 34
34 -
 35
35 -
 36
36 -
 37
37 -
 38
38 -
 39
39 -
 40
40 -
 41
41 -
 42
42 -
 43
43 -
 44
44 -
 45
45 -
 46
46 -
 47
47 -
 48
48 -
49
-
50
-
51
-
52
-
53
-
54
-
55
-
56
-
57
-
58
-
59
-
60
-
61
-
62
-
63
-
64
-
65
-
66
-
67
-
68
-
69
-
70
-
71
-
72
-
73
-
74
-
75
-
76
-
77
-
78
-
79
-
80
-
81
-
82
-
83
-
84
-
85
-
86
-
87
-
88
-
89
-
90
-
91
-
92
-
93
-
94
-
95
-
96
-
97
-
98
-
99
-
100
-
101
-
102
-
103
-
104
-
105
-
106
-
107
-
108
-
109
-
110
-
111
-
112
-
113
-
114
-
115
-
116
-
117
-
118
-
119
-
120
-
121
-
122
-
123
-
124
-
125
-
126
-
127
-
128
-
129
-
130
-
131
-
132
-
133
-
134
-
135
-
136
-
137
-
138
-
139
-
140
-
141
-
142
-
143
-
144
-
145
-
146
-
147
-
148
-
149
-
150
-
151
-
152
-
153
-
154
-
155
-
156
-
157
-
158
-
159
-
160
-
161
-
162
-
163
-
164
-
165
-
166
-
167
-
168
-
169
-
170
-
171
-
172
-
173
-
174
-
175
-
176
-
177
-
178
-
179
-
180
-
181
-
182
-
183
-
184
-
185
-
186
-
187
-
188
-
189
-
190
-
191
-
192
-
193
-
194
-
195
-
196
-
197
-
198
-
199
-
200
-
201
-
202
-
203
-
204
-
205
-
206
-
207
-
208
-
209
-
210
-
211
-
212
-
213
-
214
-
215
-
216
-
217
-
218
-
219
-
220
-
221
-
222
-
223
-
224
-
225
-
226
-
227
-
228
-
229
-
230
-
231
-
232
-
233
-
234
-
235
-
236
-
237
-
238
-
239
-
240
-
241
-
242
-
243
-
244
-
245
-
246
-
247
-
248
-
249
-
250
-
251
-
252
-
253
-
254
-
255
-
256
-
257
-
258
-
259
-
260
-
261
-
262
-
263
-
264
-
265
-
266
-
267
-
268
-
269
-
270
-
271
-
272
-
273
-
274
-
275
-
276
-
277
-
278
 |
 |

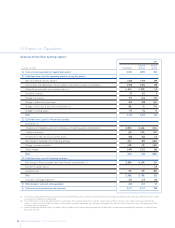
Balance Sheet by Activity Segment
At 12.31. 2005 At 12.31.2004
Industrial Financial Industrial Financial
(in millions of euros) Consolidated Activities Services Consolidated Activities Services
Intangible assets 5,943 5,762 181 5,578 5,468 110
-Goodwill 2,418 2,259 159 2,157 2,067 90
-Other intangible assets 3,525 3,503 22 3,421 3,401 20
Property, plant and equipment (1) 11,006 10,961 45 9,437 9,391 46
Investment property 26 26 – 46 46 –
Investments and other financial assets 2,333 4,184 796 4,025 5,834 565
Leased assets 1,254 4 1,250 740 7 733
Deferred tax assets 2,104 1,930 174 2,402 2,286 117
Total Non-current Assets 22,666 22,867 2,446 22,228 23,032 1,571
Inventories (1) 7,881 7,809 76 7,257 7,168 89
Trade receivables 4,969 4,856 341 5,491 5,517 445
Receivables from financing activities 15,973 4,881 15,856 17,498 7,474 17,418
Other receivables 3,084 2,922 243 2,734 2,673 216
Accrued income and prepaid expenses (2) 272 253 21 295 257 39
Current financial assets 1,041 663 378 1,237 1,086 215
-Current equity investments 31 31 – 33 33 –
-Current securities 556 204 352 353 239 189
-Other financial assets 454 428 26 851 814 26
Cash and cash equivalents 6,417 5,517 900 5,767 4,893 873
Total Current assets (2) 39,637 26,901 17,815 40,279 29,068 19,295
Assets held for sale (2) 151 151 – 15 11 4
TOTAL ASSETS 62,454 49,919 20,261 62,522 52,111 20,870
Total assets adjusted for asset-backed financing transactions
52,244 48,388 11,316 52,348 49,489 12,956
Stockholders’ equity 9,413 9,409 2,479 4,928 4,928 2,173
Provisions 8,698 8,499 199 7,290 7,117 173
-Employee benefits 3,919 3,894 25 3,682 3,656 26
-Other provisions 4,779 4,605 174 3,608 3,461 147
Debt 25,761 13,782 16,915 32,191 22,039 17,808
-Asset-backed financing 10,210 1,531 8,945 10,174 2,622 7,914
-Other debt 15,551 12,251 7,970 22,017 19,417 9,894
Other financial liabilities 189 180 9 203 177 27
Trade payables 11,777 11,700 297 11,697 12,010 220
Other payables 4,821 4,698 205 4,561 4,352 303
Deferred tax liabilities 405 375 29 522 481 40
Accrued expenses and deferred income 1,280 1,166 128 1,130 1,007 126
Liabilities held for sale 110 110 – –– –
TOTAL STOCKHOLDERS’ EQUITY AND LIABILITIES 62,454 49,919 20,261 62,522 52,111 20,870
Total liabilities adjusted for asset-backed financing transactions
52,244 48,388 11,316 52,348 49,489 12,956
(1) With respect to the figures as of December 31, 2004 published in the Quarterly Report at March 31, 2005, an amount of 416 million euros has been reclassified from “Property, plant and
equipment” to “Inventories”. This reclassification became necessary following the change in procedures for accounting for sales with buy-back commitments, as described in the section “Significant
Accounting Policies” of the Notes to the Consolidated Financial Statements.
(2) As described in the section “Significant Accounting Policies” of the Notes to the Consolidated Financial Statements, certain of the figures at December 31, 2004 published in the Quarterly Report at
March 31, 2005 have been reclassified at and from December 31, 2005. In particular, at and from that date, the item “Accrued income and prepaid expenses” is included in “Current assets” and the
item “Assets held for sale” is excluded from “Current assets” and presented separately. The corresponding figures at December 31, 2004 have therefore similarly been reclassified.
37
Report on Operations Financial Review of the Group