Chrysler 2005 Annual Report Download - page 24
Download and view the complete annual report
Please find page 24 of the 2005 Chrysler annual report below. You can navigate through the pages in the report by either clicking on the pages listed below, or by using the keyword search tool below to find specific information within the annual report.-
 1
1 -
2
-
3
-
4
-
5
-
6
-
7
-
8
-
9
-
10
-
11
-
12
-
13
-
 14
14 -
 15
15 -
 16
16 -
 17
17 -
 18
18 -
 19
19 -
 20
20 -
 21
21 -
 22
22 -
 23
23 -
 24
24 -
 25
25 -
 26
26 -
 27
27 -
 28
28 -
 29
29 -
 30
30 -
 31
31 -
 32
32 -
 33
33 -
 34
34 -
35
-
36
-
37
-
38
-
39
-
40
-
41
-
42
-
43
-
44
-
45
-
46
-
47
-
48
-
49
-
50
-
51
-
52
-
53
-
54
-
55
-
56
-
57
-
58
-
59
-
60
-
61
-
62
-
63
-
64
-
65
-
66
-
67
-
68
-
69
-
70
-
71
-
72
-
73
-
74
-
75
-
76
-
77
-
78
-
79
-
80
-
81
-
82
-
83
-
84
-
85
-
86
-
87
-
88
-
89
-
90
-
91
-
92
-
93
-
94
-
95
-
96
-
97
-
98
-
99
-
100
-
101
-
102
-
103
-
104
-
105
-
106
-
107
-
108
-
109
-
110
-
111
-
112
-
113
-
114
-
115
-
116
-
117
-
118
-
119
-
120
-
121
-
122
-
123
-
124
-
125
-
126
-
127
-
128
-
129
-
130
-
131
-
132
-
133
-
134
-
135
-
136
-
137
-
138
-
139
-
140
-
141
-
142
-
143
-
144
-
145
-
146
-
147
-
148
-
149
-
150
-
151
-
152
-
153
-
154
-
155
-
156
-
157
-
158
-
159
-
160
-
161
-
162
-
163
-
164
-
165
-
166
-
167
-
168
-
169
-
170
-
171
-
172
-
173
-
174
-
175
-
176
-
177
-
178
-
179
-
180
-
181
-
182
-
183
-
184
-
185
-
186
-
187
-
188
-
189
-
190
-
191
-
192
-
193
-
194
-
195
-
196
-
197
-
198
-
199
-
200
-
201
-
202
-
203
-
204
-
205
-
206
-
207
-
208
-
209
-
210
-
211
-
212
-
213
-
214
-
215
-
216
-
217
-
218
-
219
-
220
-
221
-
222
-
223
-
224
-
225
-
226
-
227
-
228
-
229
-
230
-
231
-
232
-
233
-
234
-
235
-
236
-
237
-
238
-
239
-
240
-
241
-
242
-
243
-
244
-
245
-
246
-
247
-
248
-
249
-
250
-
251
-
252
-
253
-
254
-
255
-
256
-
257
-
258
-
259
-
260
-
261
-
262
-
263
-
264
-
265
-
266
-
267
-
268
-
269
-
270
-
271
-
272
-
273
-
274
-
275
-
276
-
277
-
278
 |
 |

23
Report on Operations Financial Review of the Group
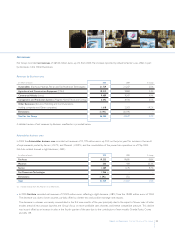
Net revenues
Fiat Group recorded net revenues of 46,544 million euros, up 2% from 2004.The increase reported by industrial Sectors was offset in part
by decreases in the Other Businesses.
Revenues by Business area
(in millions of euros) 2005 2004 % change
Automobiles (Fiat Auto, Maserati, Ferrari and Fiat Powertrain Technologies) 21,729 21,207 2.5%
Agricultural and Construction Equipment (CNH) 10,212 9,983 2.3%
Commercial Vehicles (Iveco) 9,489 9,047 4.9%
Components and Production Systems (Magneti Marelli,Teksid and Comau) 6,642 6,416 3.5%
Other Businesses (Services, Publishing and Communications,
Holding companies and Other companies) 1,618 2,003 -19.2%
Eliminations (3,146) (3,019) –
Total for the Group 46,544 45,637 2.0%
Adetailed review of net revenues by Business area/Sector is provided below.
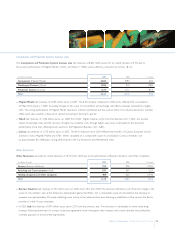
Automobiles business area
In 2005 the Automobiles business area recorded net revenues of 21,729 million euros, up 2.5% on the prior year.This increase is the result
of improvements posted by Ferrari (+9.7%) and Maserati (+30.3%), and the consolidation of the powertrain operations as of May 2005.
Fiat Auto instead showed a slight decrease (-0.8%).
(in millions of euros) 2005 2004 % change
Fiat Auto 19,533 19,695 -0.8%
Maserati 533 409 30.3%
Ferrari 1,289 1,175 9.7%
Fiat Powertrain Technologies 1,966 (1) – –
Eliminations (1,592) (72) –
Total 21,729 21,207 2.5%
(1) Includes revenues from Fiat Auto for 1,512 million euros.
In 2005 Fiat Auto recorded net revenues of 19,533 million euros, reflecting a slight decrease (-0.8%) from the 19,695 million euros of 2004.
The decrease was due to lower volumes, partially offset by a better mix and positive exchange rate impacts.
The decrease in volumes was mainly concentrated in the first nine months of the year, principally due to the impact of slower sales of older
models ahead of new product launches, the Group’s focus on more profitable sales channels, and intense competitive pressure. This decline
was in part offset by an increase in sales in the fourth quarter of the year due to the contribution of new models: Grande Punto, Croma
and Alfa 159.