Chrysler 2005 Annual Report Download - page 12
Download and view the complete annual report
Please find page 12 of the 2005 Chrysler annual report below. You can navigate through the pages in the report by either clicking on the pages listed below, or by using the keyword search tool below to find specific information within the annual report.-
 1
1 -
 2
2 -
 3
3 -
 4
4 -
 5
5 -
 6
6 -
 7
7 -
 8
8 -
 9
9 -
 10
10 -
 11
11 -
 12
12 -
 13
13 -
 14
14 -
 15
15 -
 16
16 -
 17
17 -
 18
18 -
 19
19 -
 20
20 -
 21
21 -
 22
22 -
23
-
24
-
25
-
26
-
27
-
28
-
29
-
30
-
31
-
32
-
33
-
34
-
35
-
36
-
37
-
38
-
39
-
40
-
41
-
42
-
43
-
44
-
45
-
46
-
47
-
48
-
49
-
50
-
51
-
52
-
53
-
54
-
55
-
56
-
57
-
58
-
59
-
60
-
61
-
62
-
63
-
64
-
65
-
66
-
67
-
68
-
69
-
70
-
71
-
72
-
73
-
74
-
75
-
76
-
77
-
78
-
79
-
80
-
81
-
82
-
83
-
84
-
85
-
86
-
87
-
88
-
89
-
90
-
91
-
92
-
93
-
94
-
95
-
96
-
97
-
98
-
99
-
100
-
101
-
102
-
103
-
104
-
105
-
106
-
107
-
108
-
109
-
110
-
111
-
112
-
113
-
114
-
115
-
116
-
117
-
118
-
119
-
120
-
121
-
122
-
123
-
124
-
125
-
126
-
127
-
128
-
129
-
130
-
131
-
132
-
133
-
134
-
135
-
136
-
137
-
138
-
139
-
140
-
141
-
142
-
143
-
144
-
145
-
146
-
147
-
148
-
149
-
150
-
151
-
152
-
153
-
154
-
155
-
156
-
157
-
158
-
159
-
160
-
161
-
162
-
163
-
164
-
165
-
166
-
167
-
168
-
169
-
170
-
171
-
172
-
173
-
174
-
175
-
176
-
177
-
178
-
179
-
180
-
181
-
182
-
183
-
184
-
185
-
186
-
187
-
188
-
189
-
190
-
191
-
192
-
193
-
194
-
195
-
196
-
197
-
198
-
199
-
200
-
201
-
202
-
203
-
204
-
205
-
206
-
207
-
208
-
209
-
210
-
211
-
212
-
213
-
214
-
215
-
216
-
217
-
218
-
219
-
220
-
221
-
222
-
223
-
224
-
225
-
226
-
227
-
228
-
229
-
230
-
231
-
232
-
233
-
234
-
235
-
236
-
237
-
238
-
239
-
240
-
241
-
242
-
243
-
244
-
245
-
246
-
247
-
248
-
249
-
250
-
251
-
252
-
253
-
254
-
255
-
256
-
257
-
258
-
259
-
260
-
261
-
262
-
263
-
264
-
265
-
266
-
267
-
268
-
269
-
270
-
271
-
272
-
273
-
274
-
275
-
276
-
277
-
278
 |
 |

11
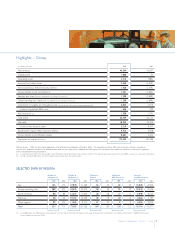
Report on Operations Highlights by Sector
Highlights by Sector
Total
Net revenues Trading profit Operating result operating assets
(in millions of euros) 2005 2004 2005 2004 2005 2004 2005 2004
Fiat Auto 19,533 19,695 (281) (822) (818) (1,412) 16,231 15,967
Maserati 533 409 (85) (168) (85) (171) 235 312
Ferrari 1,289 1,175 157 138 157 136 936 837
Fiat Powertrain Technologies 1,966 –26 –4–2,362 –
Agricultural and Construction Equipment (CNH) 10,212 9,983 698 467 611 399 17,860 15,224
Commercial Vehicles (Iveco) 9,489 9,047 415 371 289 347 7,510 9,797
Components (Magneti Marelli) 4,033 3,795 162 165 127 148 2,363 2,228
Metallurgical Products (Teksid) 1,036 910 45 (39) 27 (42) 671 576
Production Systems (Comau) 1,573 1,711 42 40 (8) 30 1,091 1,042
Services (Business Solutions) 752 976 35 41 734 341 636
Publishing and Communications (Itedi) 397 407 16 11 13 9186 161
Holding companies, Other companies and Eliminations
(4,269) (2,471) (230) (154) 1,891 (63) 915 1,784
Total for the Group 46,544 45,637 1,000 50 2,215 (585) 50,701 48,564
Total Number of
operating liabilities Investments (*) R&D expenses (**) employees
(in millions of euros) 2005 2004 2005 2004 2005 2004 2005 2004
Fiat Auto 15,638 15,269 1,582 1,792 665 952 46,099 45,122
Maserati 270 302 20 51 57 72 606 652
Ferrari 625 428 142 143 86 75 2,809 2,670
Fiat Powertrain Technologies 1,255 –173 –2–10,111 –
Agricultural and Construction Equipment (CNH) 14,483 12,128 255 243 234 221 25,420 25,746
Commercial Vehicles (Iveco) 6,213 8,342 444 330 277 243 32,373 31,037
Components (Magneti Marelli) 1,620 1,371 313 280 197 193 24,213 21,868
Metallurgical Products (Teksid) 419 389 45 44 548,952 8,571
Production Systems (Comau) 828 823 38 23 20 17 12,725 13,328
Services (Business Solutions) 437 604 19 25 ––5,436 6,519
Publishing and Communications (Itedi) 161 165 20 2––846 849
Holding companies, Other companies and Eliminations
719 1,440 1(18) 15 14 4,105 4,704
Total for the Group 42,668 41,261 3,052 2,915 1,558 1,791 173,695 161,066
(*) Investments in tangible and intangible assets (net of vehicles sold with buy-back commitments).
(**) Including capitalised R&D costs and costs charged directly to operations during the fiscal year.