Chrysler 2005 Annual Report Download - page 10
Download and view the complete annual report
Please find page 10 of the 2005 Chrysler annual report below. You can navigate through the pages in the report by either clicking on the pages listed below, or by using the keyword search tool below to find specific information within the annual report.-
 1
1 -
 2
2 -
 3
3 -
 4
4 -
 5
5 -
 6
6 -
 7
7 -
 8
8 -
 9
9 -
 10
10 -
 11
11 -
 12
12 -
 13
13 -
 14
14 -
 15
15 -
 16
16 -
 17
17 -
 18
18 -
 19
19 -
 20
20 -
 21
21 -
22
-
23
-
24
-
25
-
26
-
27
-
28
-
29
-
30
-
31
-
32
-
33
-
34
-
35
-
36
-
37
-
38
-
39
-
40
-
41
-
42
-
43
-
44
-
45
-
46
-
47
-
48
-
49
-
50
-
51
-
52
-
53
-
54
-
55
-
56
-
57
-
58
-
59
-
60
-
61
-
62
-
63
-
64
-
65
-
66
-
67
-
68
-
69
-
70
-
71
-
72
-
73
-
74
-
75
-
76
-
77
-
78
-
79
-
80
-
81
-
82
-
83
-
84
-
85
-
86
-
87
-
88
-
89
-
90
-
91
-
92
-
93
-
94
-
95
-
96
-
97
-
98
-
99
-
100
-
101
-
102
-
103
-
104
-
105
-
106
-
107
-
108
-
109
-
110
-
111
-
112
-
113
-
114
-
115
-
116
-
117
-
118
-
119
-
120
-
121
-
122
-
123
-
124
-
125
-
126
-
127
-
128
-
129
-
130
-
131
-
132
-
133
-
134
-
135
-
136
-
137
-
138
-
139
-
140
-
141
-
142
-
143
-
144
-
145
-
146
-
147
-
148
-
149
-
150
-
151
-
152
-
153
-
154
-
155
-
156
-
157
-
158
-
159
-
160
-
161
-
162
-
163
-
164
-
165
-
166
-
167
-
168
-
169
-
170
-
171
-
172
-
173
-
174
-
175
-
176
-
177
-
178
-
179
-
180
-
181
-
182
-
183
-
184
-
185
-
186
-
187
-
188
-
189
-
190
-
191
-
192
-
193
-
194
-
195
-
196
-
197
-
198
-
199
-
200
-
201
-
202
-
203
-
204
-
205
-
206
-
207
-
208
-
209
-
210
-
211
-
212
-
213
-
214
-
215
-
216
-
217
-
218
-
219
-
220
-
221
-
222
-
223
-
224
-
225
-
226
-
227
-
228
-
229
-
230
-
231
-
232
-
233
-
234
-
235
-
236
-
237
-
238
-
239
-
240
-
241
-
242
-
243
-
244
-
245
-
246
-
247
-
248
-
249
-
250
-
251
-
252
-
253
-
254
-
255
-
256
-
257
-
258
-
259
-
260
-
261
-
262
-
263
-
264
-
265
-
266
-
267
-
268
-
269
-
270
-
271
-
272
-
273
-
274
-
275
-
276
-
277
-
278
 |
 |

9
Report on Operations Highlights – Group
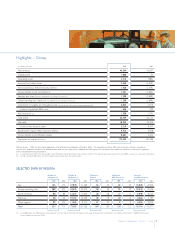
Highlights – Group
(in millions of euros) 2005 2004
Net revenues 46,544 45,637
Trading profit 1,000 50
Operating result 2,215 (585)
Income/(loss) before taxes 2,264 (1,629)
Net income/(loss) before minority interest 1,420 (1,579)
Group interest in net income/(loss) 1,331 (1,634)
Earnings per share (ordinary, preference, and savings) (in euros) (1) 1.250 (1.699)
Diluted earnings per share (ordinary, preference, and savings) (in euros) (1) 1.250 (1.699)
Investments in tangible and intangible assets (net of vehicles sold under buy-back commitments) 3,052 2,915
of which: Capitalised R&D costs 656 753
R&D expenses (2) 1,558 1,791
Total assets 62,454 62,522
Net debt 18,523 25,423
of which: Net industrial debt 3,219 9,447
Stockholders’ equity before minority interest 9,413 4,928
Group interest in stockholders’ equity 8,681 4,304
Employees at year-end (number) 173,695 161,066
Effective January 1, 2005, the Fiat Group adopted the International Financial Reporting Standards (IFRS). The comparative data for 2004 have thus been restated in accordance
with the new accounting standards. For additional information on the impact of their adoption on 2004 figures that had already been published, reference is made to the Appendix 1
of the Consolidated Financial Statements.
(1) In accordance with IAS 33, the dilutive effects of the Mandatory Convertible Facility have not been included in the determination of earnings per share for 2004, as there was anet loss for the period.
(2) Includes capitalised R&D costs and costs charged directly to operations for the fiscal year.
SELECTED DATABY REGION
Number of Number of Number of Number of Revenues
Companies (*) Employees (*) Facilities R&D Centres (*) (in millions of euros)
2005 2004 2005 2004 2005 2004 2005 2004 2005 2004
Italy 155 173 77,070 71,469 56 54 52 53 13,078 14,903
Europe excluding Italy 280 305 43,376 43,253 58 56 32 33 18,518 17,646
North America 80 89 12,572 12,400 28 28 17 17 6,048 6,020
Mercosur 40 43 29,132 24,229 20 19 10 10 4,364 3,195
Other regions 99 104 11,545 9,715 27 23 994,536 3,873
Total 654 714 173,695 161,066 189 180 120 122 46,544 45,637
(*) Fiscal 2004 figures are different from those published until now due to the impact of changes in the scope of consolidation resulting from the adoption, from January 1, 2005, of International
Financial Reporting Standards (IFRS).