Chrysler 2005 Annual Report Download - page 26
Download and view the complete annual report
Please find page 26 of the 2005 Chrysler annual report below. You can navigate through the pages in the report by either clicking on the pages listed below, or by using the keyword search tool below to find specific information within the annual report.-
 1
1 -
 2
2 -
 3
3 -
 4
4 -
 5
5 -
 6
6 -
 7
7 -
 8
8 -
 9
9 -
 10
10 -
 11
11 -
 12
12 -
 13
13 -
 14
14 -
 15
15 -
 16
16 -
 17
17 -
 18
18 -
 19
19 -
 20
20 -
 21
21 -
 22
22 -
 23
23 -
 24
24 -
 25
25 -
 26
26 -
 27
27 -
 28
28 -
 29
29 -
 30
30 -
 31
31 -
 32
32 -
 33
33 -
 34
34 -
 35
35 -
 36
36 -
 37
37 -
 38
38 -
 39
39 -
 40
40 -
 41
41 -
 42
42 -
 43
43 -
 44
44 -
 45
45 -
 46
46 -
 47
47 -
 48
48 -
 49
49 -
 50
50 -
 51
51 -
 52
52 -
 53
53 -
 54
54 -
 55
55 -
 56
56 -
 57
57 -
 58
58 -
 59
59 -
 60
60 -
 61
61 -
 62
62 -
 63
63 -
 64
64 -
 65
65 -
 66
66 -
 67
67 -
 68
68 -
 69
69 -
 70
70 -
 71
71 -
 72
72 -
 73
73 -
 74
74 -
 75
75 -
 76
76 -
 77
77 -
 78
78 -
 79
79 -
 80
80 -
 81
81 -
 82
82 -
 83
83 -
 84
84 -
 85
85 -
 86
86 -
 87
87 -
 88
88 -
 89
89 -
 90
90 -
 91
91 -
 92
92 -
 93
93 -
 94
94 -
 95
95 -
 96
96 -
 97
97 -
 98
98 -
 99
99 -
 100
100 -
 101
101 -
 102
102 -
 103
103 -
 104
104 -
 105
105 -
 106
106 -
 107
107 -
 108
108 -
 109
109 -
 110
110 -
 111
111 -
 112
112 -
 113
113 -
 114
114 -
 115
115 -
 116
116 -
 117
117 -
 118
118 -
 119
119 -
 120
120 -
 121
121 -
 122
122 -
 123
123 -
 124
124 -
 125
125 -
 126
126 -
 127
127 -
 128
128 -
 129
129 -
 130
130 -
 131
131 -
 132
132 -
 133
133 -
 134
134 -
 135
135 -
 136
136 -
 137
137 -
 138
138 -
 139
139 -
 140
140 -
 141
141 -
 142
142 -
 143
143 -
 144
144 -
 145
145 -
 146
146 -
 147
147 -
 148
148 -
 149
149 -
 150
150 -
 151
151 -
 152
152 -
 153
153 -
 154
154 -
 155
155 -
 156
156 -
 157
157 -
 158
158 -
 159
159 -
 160
160 -
 161
161 -
 162
162 -
 163
163 -
 164
164 -
 165
165 -
 166
166 -
 167
167 -
 168
168 -
 169
169 -
 170
170 -
 171
171 -
 172
172 -
 173
173 -
 174
174 -
 175
175 -
 176
176 -
 177
177 -
 178
178 -
 179
179 -
 180
180 -
 181
181 -
 182
182 -
 183
183 -
 184
184 -
 185
185 -
 186
186 -
 187
187 -
 188
188 -
 189
189 -
 190
190 -
 191
191 -
 192
192 -
 193
193 -
 194
194 -
 195
195 -
 196
196 -
 197
197 -
 198
198 -
 199
199 -
 200
200 -
 201
201 -
 202
202 -
 203
203 -
 204
204 -
 205
205 -
 206
206 -
 207
207 -
 208
208 -
 209
209 -
 210
210 -
 211
211 -
 212
212 -
 213
213 -
 214
214 -
 215
215 -
 216
216 -
 217
217 -
 218
218 -
 219
219 -
 220
220 -
 221
221 -
 222
222 -
 223
223 -
 224
224 -
 225
225 -
 226
226 -
 227
227 -
 228
228 -
 229
229 -
 230
230 -
 231
231 -
 232
232 -
 233
233 -
 234
234 -
 235
235 -
 236
236 -
 237
237 -
 238
238 -
 239
239 -
 240
240 -
 241
241 -
 242
242 -
 243
243 -
 244
244 -
 245
245 -
 246
246 -
 247
247 -
 248
248 -
 249
249 -
 250
250 -
 251
251 -
 252
252 -
 253
253 -
 254
254 -
 255
255 -
 256
256 -
 257
257 -
 258
258 -
 259
259 -
 260
260 -
 261
261 -
 262
262 -
 263
263 -
 264
264 -
 265
265 -
 266
266 -
 267
267 -
 268
268 -
 269
269 -
 270
270 -
 271
271 -
 272
272 -
 273
273 -
 274
274 -
 275
275 -
 276
276 -
 277
277 -
 278
278
 |
 |

25
Report on Operations Financial Review of the Group
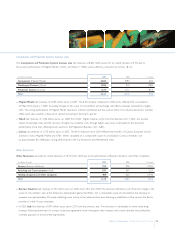
Components and Production Systems business area
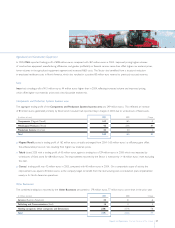
The Components and Production Systems business area had revenues of 6,642 million euros, for an overall increase of 3.5%, due to
the positive performance of Magneti Marelli (+6.3%) and Teksid (+13.8%), partly offset by a reduction at Comau (-8.1%).
(in millions of euros) 2005 2004 % change
Components (Magneti Marelli) 4,033 3,795 6.3%
Metallurgical Products (Teksid) 1,036 910 13.8%
Production Systems (Comau) 1,573 1,711 -8.1%
Total 6,642 6,416 3.5%
Magneti Marelli had revenues of 4,033 million euros in 2005. The 6.3% increase compared to 2004 partly reflected the consolidation
of Mako from January 1, 2005. Excluding changes in the scope of consolidation and exchange rate effects, revenues increased by roughly
2.0%. The strong performance of Magneti Marelli operations in Brazil and Poland and the positive trend of its onboard electronics activities
offset lower sales volumes in Italy, which started recovering in the fourth quarter.
Teksid had revenues of 1,036 million euros, up 13.8% from 2004. Higher volumes at the Cast Iron Business Unit (+4.6%), the positive
impact of exchange rates, and the recovery of higher raw materials costs through higher sales prices contributed to the improved
performance, more than offsetting lower volume in the Magnesium Business Unit (-6.8%).
Comau had revenues of 1,573 million euros in 2005. The 8.1% reduction from 2004 reflected the transfer of Comau’sEuropean service
activities to Iveco, Magneti Marelli, and CNH. When calculated on a comparable scope of consolidation, Comau’s revenues rose
by approximately 6%, reflecting a strong performance in the Car Bodywork and Maintenance areas.
Other Businesses
Other Businesses recorded an overall decrease of 19.2% from 2004 due to the performance of Business Solutions and Other companies.
(in millions of euros) 2005 2004 % change
Services (Business Solutions) 752 976 -23.0%
Publishing and Communications (Itedi) 397 407 -2.5%
Holding companies and Other companies 469 620 -24.4%
Total 1,618 2,003 -19.2%
Business Solutions had revenues of 752 million euros in 2005, down 23% from 2004.The decrease stemmed in part from the change in the
scope of consolidation (sale of the temporaryemployment agency WorkNet). On a comparable scope of consolidation, the decrease in
revenues was approximately 5%, mainly reflecting lower activity in the administration area, following a redefinition of the services the Sector
provides to other Group companies.
In 2005, Itedi had revenues of 397 million euros, down 2.5% from the previous year. The downturn is attributable to lower advertising
revenues following termination of a major concession agreement, lower newspaper sales revenues, and a more selective and profitability-
oriented approach to brand stretching initiatives.
