Chrysler 2005 Annual Report Download - page 106
Download and view the complete annual report
Please find page 106 of the 2005 Chrysler annual report below. You can navigate through the pages in the report by either clicking on the pages listed below, or by using the keyword search tool below to find specific information within the annual report.-
 1
1 -
2
-
3
-
4
-
5
-
6
-
7
-
8
-
9
-
10
-
11
-
12
-
13
-
14
-
15
-
16
-
17
-
18
-
19
-
20
-
21
-
22
-
23
-
24
-
25
-
26
-
27
-
28
-
29
-
30
-
31
-
32
-
33
-
34
-
35
-
36
-
37
-
38
-
39
-
40
-
41
-
42
-
43
-
44
-
45
-
46
-
47
-
48
-
49
-
50
-
51
-
52
-
53
-
54
-
55
-
56
-
57
-
58
-
59
-
60
-
61
-
62
-
63
-
64
-
65
-
66
-
67
-
68
-
69
-
70
-
71
-
72
-
73
-
74
-
75
-
76
-
77
-
78
-
79
-
80
-
81
-
82
-
83
-
84
-
85
-
86
-
87
-
88
-
89
-
90
-
91
-
92
-
93
-
94
-
95
-
 96
96 -
 97
97 -
 98
98 -
 99
99 -
 100
100 -
 101
101 -
 102
102 -
 103
103 -
 104
104 -
 105
105 -
 106
106 -
 107
107 -
 108
108 -
 109
109 -
 110
110 -
 111
111 -
 112
112 -
 113
113 -
 114
114 -
 115
115 -
 116
116 -
117
-
118
-
119
-
120
-
121
-
122
-
123
-
124
-
125
-
126
-
127
-
128
-
129
-
130
-
131
-
132
-
133
-
134
-
135
-
136
-
137
-
138
-
139
-
140
-
141
-
142
-
143
-
144
-
145
-
146
-
147
-
148
-
149
-
150
-
151
-
152
-
153
-
154
-
155
-
156
-
157
-
158
-
159
-
160
-
161
-
162
-
163
-
164
-
165
-
166
-
167
-
168
-
169
-
170
-
171
-
172
-
173
-
174
-
175
-
176
-
177
-
178
-
179
-
180
-
181
-
182
-
183
-
184
-
185
-
186
-
187
-
188
-
189
-
190
-
191
-
192
-
193
-
194
-
195
-
196
-
197
-
198
-
199
-
200
-
201
-
202
-
203
-
204
-
205
-
206
-
207
-
208
-
209
-
210
-
211
-
212
-
213
-
214
-
215
-
216
-
217
-
218
-
219
-
220
-
221
-
222
-
223
-
224
-
225
-
226
-
227
-
228
-
229
-
230
-
231
-
232
-
233
-
234
-
235
-
236
-
237
-
238
-
239
-
240
-
241
-
242
-
243
-
244
-
245
-
246
-
247
-
248
-
249
-
250
-
251
-
252
-
253
-
254
-
255
-
256
-
257
-
258
-
259
-
260
-
261
-
262
-
263
-
264
-
265
-
266
-
267
-
268
-
269
-
270
-
271
-
272
-
273
-
274
-
275
-
276
-
277
-
278
 |
 |

105
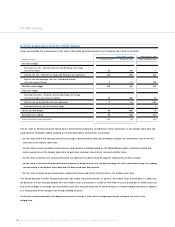
Fiat Group Consolidated Financial Statements at December 31, 2005 - N otes to the Consolidated Financial Statements
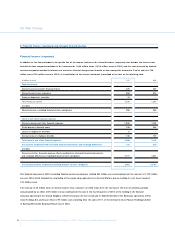
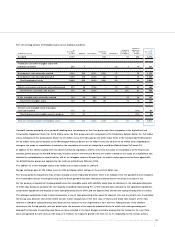
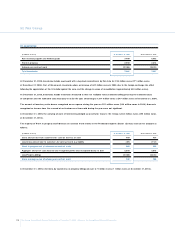
Changes in accumulated depreciation and impairment losses were as follows:
At Change in At
December Impairment the scope of Translation O ther D ecember
(in millions of euros) 31, 2004 D epreciation losses Divestitures consolidation differences changes 31, 2005
Land 7 – – – – – – 7
O wned industrial buildings 1,931 133 30 (104) 14 85 33 2,122
Industrial buildings leased under finance leases 5 3 – – – – 2 10
Total Industrial buildings 1,936 136 30 (104) 14 85 35 2,132
O wned plant, machinery and equipment 14,576 1,435 59 (1,050) 2,751 482 12 18,265
Plant, machinery and equipment leased
under finance leases 11 4 – – – 1 12 28
Total Plant, machinery and equipment 14,587 1,439 59 (1,050) 2,751 483 24 18,293
Assets sold with a buy-back commitment 389 150 24 (164) – 2 5 406
O wned other tangible assets 1,410 137 – (107) 65 51 (26) 1,530
O ther tangible assets leased under finance leases 1 2 – – – – 1 4
Total O ther tangible assets 1,411 139 – (107) 65 51 (25) 1,534
Advances and tangible assets in progress 6 2 – – – 1 – 9
Total accumulated depreciation and impairment
of Property, plant and equipment 18,336 1,866 113 (1,425) 2,830 622 39 22,381
The column O ther changes includes the reversal of impairment losses on previously impaired assets amounting to 16 million euros in 2005
(there was no reversal of impairment losses in 2004).
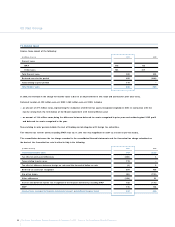
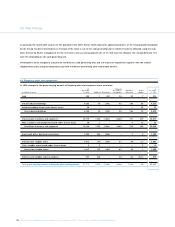
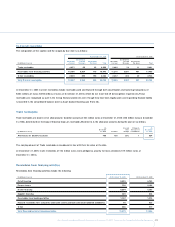
The net carrying amount of Property, plant and equipment can be analysed as follows:
At Change in
At
December Impairment the scope of Translation O ther December
(in millions of euros) 31, 2004 Additions Depreciation losses D ivestitures consolidation differences changes 31, 2005
Land 493 1 – – (25) 26 24 7 526
O wned industrial buildings 2,157 76 (133) (30) (39) 79 104 16 2,230
Industrial buildings leased under
finance leases 43 – (3) ––––23 63
Total Industrial buildings 2,200 76 (136) (30) (39) 79 104 39 2,293
O wned plant, machinery and equipment 4,543 1,148 (1,435) (59) (31) 1,088 229 465 5,948
Plant, machinery and equipment
leased under finance leases 18 7 (4) –––31 25
Total Plant, machinery and equipment 4,561 1,155 (1,439) (59) (31) 1,088 232 466 5,973
Assets sold with a buy-back commitment 1,106 468 (150) (24) (232) – 5 3 1,176
O wned other tangible assets 402 170 (137) – (80) 16 28 25 424
O ther tangible assets leased
under finance leases 4 5 (2) ––––1 8
Total O ther tangible assets 406 175 (139) – (80) 16 28 26 432
Advances and tangible assets in progress 671 400 (2) – – 49 29 (541) 606
Total net carrying amount of Property,
plant and equipment 9,437 2,275 (1,866) (113) (407) 1,258 422 – 11,006