Capital One 2005 Annual Report Download - page 97
Download and view the complete annual report
Please find page 97 of the 2005 Capital One annual report below. You can navigate through the pages in the report by either clicking on the pages listed below, or by using the keyword search tool below to find specific information within the annual report.-
 1
1 -
2
-
3
-
4
-
5
-
6
-
7
-
8
-
9
-
10
-
11
-
12
-
13
-
14
-
15
-
16
-
17
-
18
-
19
-
20
-
21
-
22
-
23
-
24
-
25
-
26
-
27
-
28
-
29
-
30
-
31
-
32
-
33
-
34
-
35
-
36
-
37
-
38
-
39
-
40
-
41
-
42
-
43
-
44
-
45
-
46
-
47
-
48
-
49
-
50
-
51
-
52
-
53
-
54
-
55
-
56
-
57
-
58
-
59
-
60
-
61
-
62
-
63
-
64
-
65
-
66
-
67
-
68
-
69
-
70
-
71
-
72
-
73
-
74
-
75
-
76
-
77
-
78
-
79
-
80
-
81
-
82
-
83
-
84
-
85
-
86
-
 87
87 -
 88
88 -
 89
89 -
 90
90 -
 91
91 -
 92
92 -
 93
93 -
 94
94 -
 95
95 -
 96
96 -
 97
97 -
 98
98 -
 99
99 -
 100
100 -
 101
101 -
 102
102 -
 103
103 -
 104
104 -
 105
105 -
 106
106 -
 107
107 -
108
-
109
-
110
-
111
-
112
-
113
-
114
-
115
-
116
-
117
-
118
-
119
-
120
-
121
-
122
-
123
-
124
-
125
-
126
-
127
-
128
-
129
 |
 |

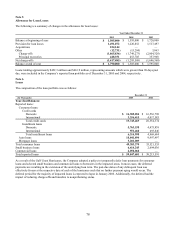
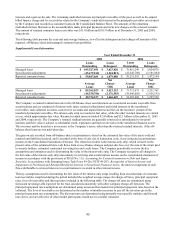
Significant components of the provision for income taxes attributable to continuing operations were as follows:
Year Ended December 31
2005 2004 2003
Federal taxes $ 899,646 $ 749,800 $ 614,730
State taxes 30,180 33,849 8,346
International taxes (19,558) 35,107 5,914
Deferred income taxes 109,587 (2,174) 38,092
Income taxes $ 1,019,855 $ 816,582 $ 667,082
The reconciliation of income tax attributable to continuing operations computed at the U.S. federal statutory tax rate to
come tax expense was: in
Year Ended December 31
2005 2004 2003
Income tax at statutory federal tax rate 35.00% 35.00% 35.00%
Other, including state taxes 1.05 (0.40) 2.00
Income taxes 36.05% 34.60% 37.00%
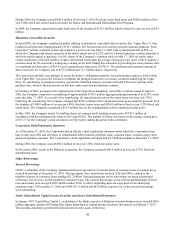
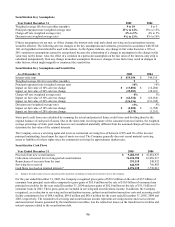
Note 15
E
arnings Per Share
The following table sets forth the computation of basic and diluted earnings per share:
Year Ended December 31
(Shares in Thousands) 2005 2004 2003
Numerator:
Income before change in accounting principle $ 1,809,147 $ 1,543,482 $ 1,150,879
Cumulative effect of accounting change —
— (15,037)
Net income $ 1,809,147 $ 1,543,482 $ 1,135,842
Denominator:
Denominator for basic earnings per share-
Weighted-average shares 259,159
235,613 224,832
Effect of dilutive securities:
Stock options 7,367
10,594 8,471
Restricted stock and units 2,382
2,560 800
Dilutive potential common shares 9,749
13,154 9,271
Denominator for diluted earnings per share-
Adjusted weighted-average shares 268,908
248,767 234,103
Basic earnings per share
Before cumulative effect of accounting change $ 6.98
$ 6.55 $ 5.12
Cumulative effect of accounting change —
— (0.07)
After cumulative effect of accounting change $ 6.98
$ 6.55 $ 5.05
Diluted earnings per share
Before cumulative effect of accounting change $ 6.73
$ 6.21 $ 4.92
Cumulative effect of accounting change —
— (0.07)
After cumulative effect of accounting change $ 6.73
$ 6.21 $ 4.85
Securities of approximately 1,862,000, 218,000 and 20,755,000 during 2005, 2004 and 2003, respectively, were not included
the computation of diluted earnings per share because their inclusion would be antidilutive. in
88