Capital One 2005 Annual Report Download - page 100
Download and view the complete annual report
Please find page 100 of the 2005 Capital One annual report below. You can navigate through the pages in the report by either clicking on the pages listed below, or by using the keyword search tool below to find specific information within the annual report.-
 1
1 -
2
-
3
-
4
-
5
-
6
-
7
-
8
-
9
-
10
-
11
-
12
-
13
-
14
-
15
-
16
-
17
-
18
-
19
-
20
-
21
-
22
-
23
-
24
-
25
-
26
-
27
-
28
-
29
-
30
-
31
-
32
-
33
-
34
-
35
-
36
-
37
-
38
-
39
-
40
-
41
-
42
-
43
-
44
-
45
-
46
-
47
-
48
-
49
-
50
-
51
-
52
-
53
-
54
-
55
-
56
-
57
-
58
-
59
-
60
-
61
-
62
-
63
-
64
-
65
-
66
-
67
-
68
-
69
-
70
-
71
-
72
-
73
-
74
-
75
-
76
-
77
-
78
-
79
-
80
-
81
-
82
-
83
-
84
-
85
-
86
-
87
-
88
-
89
-
 90
90 -
 91
91 -
 92
92 -
 93
93 -
 94
94 -
 95
95 -
 96
96 -
 97
97 -
 98
98 -
 99
99 -
 100
100 -
 101
101 -
 102
102 -
 103
103 -
 104
104 -
 105
105 -
 106
106 -
 107
107 -
 108
108 -
 109
109 -
 110
110 -
111
-
112
-
113
-
114
-
115
-
116
-
117
-
118
-
119
-
120
-
121
-
122
-
123
-
124
-
125
-
126
-
127
-
128
-
129
 |
 |

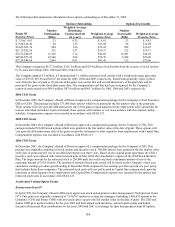
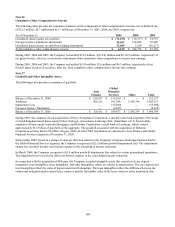
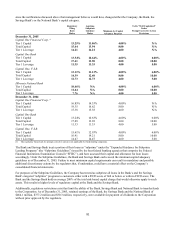
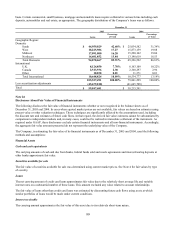
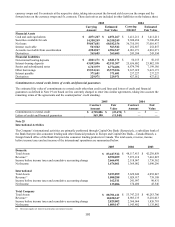
since the notifications discussed above that management believes would have changed either the Company, the Bank, the
avings Bank’ s or the National Bank’ s capital category. S
Regulatory
Filing
Basis
Ratios
Applying
Subprime
Guidance
Ratios Minimum for Capital
Adequacy Purposes
To Be “Well Capitalized”
Under
Prompt Corrective Action
Provisions
December 31, 2005
Capital One Financial Corp. (1)
Tier 1 Capital 13.25% 11.86% 4.00% N/A
Total Capital 15.44 13.94 8.00 N/A
Tier 1 Leverage 14.21 14.21 4.00 N/A
Capital One Bank
Tier 1 Capital 13.54% 10.64% 4.00% 6.00%
Total Capital 17.41 13.90 8.00 10.00
Tier 1 Leverage 11.35 11.35 4.00 5.00
Capital One, F.S.B.
Tier 1 Capital 13.11% 11.13% 4.00% 6.00%
Total Capital 14.39 12.40 8.00 10.00
Tier 1 Leverage 12.73 12.73 4.00 5.00
Hibernia National Bank
Tier 1 Capital 10.46% N/A 4.00% 6.00%
Total Capital 11.64 N/A 8.00 10.00
Tier 1 Leverage 7.76 N/A 4.00 5.00
December 31, 2004
Capital One Financial Corp. (1)
Tier 1 Capital 16.85% 14.33% 4.00% N/A
Total Capital 19.35 16.62 8.00 N/A
Tier 1 Leverage 15.38 15.38 4.00 N/A
Capital One Bank
13.24%
10.63%
4.00%
6.00%Tier 1 Capital
Total Capital 17.09 13.92 8.00 10.00
Tier 1 Leverage 11.33 11.33 4.00 5.00
Capital One, F.S.B.
Tier 1 Capital 15.61% 12.93% 4.00% 6.00%
Total Capital 16.91 14.21 8.00 10.00
Tier 1 Leverage 14.47 14.47 4.00 5.00
(1
) The regulatory framework for prompt corrective action is not applicable for bank holding companies.
The Bank and Savings Bank treat a portion of their loans as “subprime” under the “Expanded Guidance for Subprime
Lending Programs” (the “Subprime Guidelines”) issued by the four federal banking agencies that comprise the Federal
Financial Institutions Examination Council (“FFIEC”), and have assessed their capital and allowance for loan losses
accordingly. Under the Subprime Guidelines, the Bank and Savings Bank each exceed the minimum capital adequacy
guidelines as of December 31, 2005. Failure to meet minimum capital requirements can result in mandatory and possible
additional discretionary actions by the regulators that, if undertaken, could have a material effect on the Company’ s
consolidated financial statements.
For purposes of the Subprime Guidelines, the Company has treated as subprime all loans in the Bank’ s and the Savings
Bank’ s targeted “subprime” programs to customers either with a FICO score of 660 or below or with no FICO score. The
Bank and the Savings Bank hold on average 200% of the total risk-based capital charge that would otherwise apply to such
ssets. This results in higher levels of regulatory capital at the Bank and the Savings Bank. a
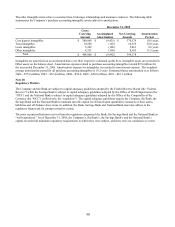
Additionally, regulatory restrictions exist that limit the ability of the Bank, Savings Bank and National Bank to transfer funds
to the Corporation. As of December 31, 2005, retained earnings of the Bank, the Savings Bank and the National Bank of
$464.1 million, $377.2 million and $30.3 million, respectively, were available for payment of dividends to the Corporation
without prior approval by the regulators.
91