Capital One 2005 Annual Report Download - page 54
Download and view the complete annual report
Please find page 54 of the 2005 Capital One annual report below. You can navigate through the pages in the report by either clicking on the pages listed below, or by using the keyword search tool below to find specific information within the annual report.-
 1
1 -
2
-
3
-
4
-
5
-
6
-
7
-
8
-
9
-
10
-
11
-
12
-
13
-
14
-
15
-
16
-
17
-
18
-
19
-
20
-
21
-
22
-
23
-
24
-
25
-
26
-
27
-
28
-
29
-
30
-
31
-
32
-
33
-
34
-
35
-
36
-
37
-
38
-
39
-
40
-
41
-
42
-
43
-
 44
44 -
 45
45 -
 46
46 -
 47
47 -
 48
48 -
 49
49 -
 50
50 -
 51
51 -
 52
52 -
 53
53 -
 54
54 -
 55
55 -
 56
56 -
 57
57 -
 58
58 -
 59
59 -
 60
60 -
 61
61 -
 62
62 -
 63
63 -
 64
64 -
65
-
66
-
67
-
68
-
69
-
70
-
71
-
72
-
73
-
74
-
75
-
76
-
77
-
78
-
79
-
80
-
81
-
82
-
83
-
84
-
85
-
86
-
87
-
88
-
89
-
90
-
91
-
92
-
93
-
94
-
95
-
96
-
97
-
98
-
99
-
100
-
101
-
102
-
103
-
104
-
105
-
106
-
107
-
108
-
109
-
110
-
111
-
112
-
113
-
114
-
115
-
116
-
117
-
118
-
119
-
120
-
121
-
122
-
123
-
124
-
125
-
126
-
127
-
128
-
129
 |
 |

T
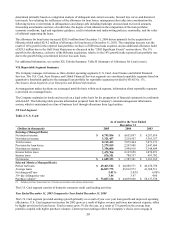
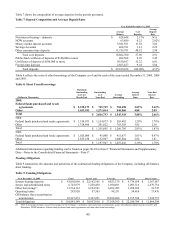
able 7: Deposit Composition and Average Deposit Rates
Year Ended December 31, 2005
Average
Balance % of
Deposits
Average
Deposit
Rate
Non-interest bearing—domestic $ 628,648 2.17% N/A
NOW accounts 63,889 0.22 2.02%
Money market deposit accounts 3,941,591 13.58 3.02
Savings Accounts 408,781 1.41 2.22
Other consumer time deposits 11,759,791 40.52 2.90
Total core deposits 16,802,700 57.90 2.91
Public fund certificate of deposits of $100,000 or more 202,568 0.70 3.45
Certificates of deposit of $100,000 or more 9,350,957 32.22 6.01
Foreign time deposits 2,663,427 9.18 5.04
Total deposits $ 29,019,652 100.00% 4.13%
Table 8 reflects the costs of other borrowings of the Company as of and for each of the years ended December 31, 2005, 2004
and 2003.
Table 8: Short Term Borrowings
(Dollars in Thousands)
Maximum
Outstanding
as of any
Month-End
Outstanding
as of
Year-End Average
Outstanding
Average
Interest
Rate
Year-End
Interest
Rate
2005:
Federal funds purchased and resale
agreements $ 2,332,173 $ 745,719 $ 704,458 2.69% 3.62%
Other 1,453,181 1,271,014 840,860 4.88 2.09
Total $ 2,016,733 $ 1,545,318 3.88% 2.66%
2004:
Federal funds purchased and resale agreements $ 1,154,073 $ 1,154,073 $ 503,482 1.29% 1.78%
Other 1,318,404 201,622 763,303 3.85 2.10
Total $ 1,355,695 $ 1,266,785 2.83% 1.83%
2003:
Federal funds purchased and resale agreements $ 1,025,000 $ 45,000 $ 412,637 1.01% 0.97%
Other 1,835,238 1,152,947 1,006,804 2.82 1.81
Total $ 1,197,947 $ 1,419,441 2.30% 1.78%
Data—Notes to the Consolidated Financial Statements—Note 9”.
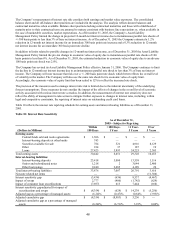
Funding Obligations
Table 9 summarizes the amounts and maturities of the contractual funding obligations of the Company, including off-balance
eet funding. sh
Table 9: Funding Obligations
As of December 31, 2005 Total Up to 1 year 1-3 years 4-5 years After 5 years
Interest-bearing deposits $ 43,092,096 $ 22,162,105 $ 9,823,370 $ 9,739,034 $ 1,367,587
Senior and subordinated notes 6,743,979 1,220,438 1,950,491 1,093,316 2,479,734
Other borrowings(1) 15,534,161 6,194,521 6,262,285 3,058,620 18,735
Operating leases 283,920 57,503 98,531 54,410 73,476
Off-balance sheet securitization
amortization 45,227,433 9,323,251 19,824,086 8,155,324 7,924,772
Total obligations $ 110,881,589 $ 38,957,818 $ 37,958,763 $ 22,100,704 $ 11,864,304
(1) Other borrowings includes secured borrowings for the Company’ s on-balance sheet auto loan securitizations, junior subordinated capital income securities and
debentures, FHLB advances, federal funds purchased and resale agreements and other short-term borrowings.
45
Table 7 shows the composition of average deposits for the periods presented.
Additional information regarding funding can be found on pages 80-82 in Item 8 “Financial Statements and Supplementary