Capital One 2005 Annual Report Download - page 40
Download and view the complete annual report
Please find page 40 of the 2005 Capital One annual report below. You can navigate through the pages in the report by either clicking on the pages listed below, or by using the keyword search tool below to find specific information within the annual report.-
 1
1 -
2
-
3
-
4
-
5
-
6
-
7
-
8
-
9
-
10
-
11
-
12
-
13
-
14
-
15
-
16
-
17
-
18
-
19
-
20
-
21
-
22
-
23
-
24
-
25
-
26
-
27
-
28
-
29
-
 30
30 -
 31
31 -
 32
32 -
 33
33 -
 34
34 -
 35
35 -
 36
36 -
 37
37 -
 38
38 -
 39
39 -
 40
40 -
 41
41 -
 42
42 -
 43
43 -
 44
44 -
 45
45 -
 46
46 -
 47
47 -
 48
48 -
 49
49 -
 50
50 -
51
-
52
-
53
-
54
-
55
-
56
-
57
-
58
-
59
-
60
-
61
-
62
-
63
-
64
-
65
-
66
-
67
-
68
-
69
-
70
-
71
-
72
-
73
-
74
-
75
-
76
-
77
-
78
-
79
-
80
-
81
-
82
-
83
-
84
-
85
-
86
-
87
-
88
-
89
-
90
-
91
-
92
-
93
-
94
-
95
-
96
-
97
-
98
-
99
-
100
-
101
-
102
-
103
-
104
-
105
-
106
-
107
-
108
-
109
-
110
-
111
-
112
-
113
-
114
-
115
-
116
-
117
-
118
-
119
-
120
-
121
-
122
-
123
-
124
-
125
-
126
-
127
-
128
-
129
 |
 |

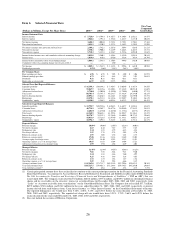
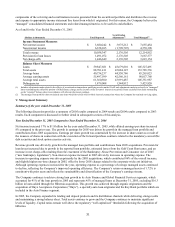
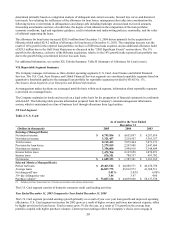
components of the servicing and securitizations income generated from the securitized portfolio and distributes the revenue
and expense to appropriate income statement line items from which it originated. For this reason, the Company believes the
“managed” consolidated financial statements and related managed metrics to be useful to stakeholders.
As of and for the Year Ended December 31, 2005
(Dollars in thousands) Total Reported Securitization
Adjustments(1) Total Managed(2)
Income Statement Measures
Net interest income $ 3,680,242 $ 3,975,212 $ 7,655,454
Non-interest income 6,358,105 (1,798,707) 4,559,398
Total revenue 10,038,347 2,176,505 12,214,852
Provision for loan losses 1,491,072 2,176,505 3,667,577
Net charge-offs 1,446,649 2,176,505 3,623,154
Balance Sheet Measures
Loans $ 59,847,681 $ 45,679,810 $ 105,527,491
Total assets 88,701,411 45,084,125 133,785,536
Average loans 40,734,237 44,530,786 85,265,023
Average earning assets 55,497,599 42,560,161 98,057,760
Average total assets 61,360,500 43,991,487 105,351,987
Delinquencies 1,879,008 1,544,812 3,423,820
(1) Includes adjustments made related to the effects of securitization transactions qualifying as sales under GAAP and adjustments made to reclassify to “managed”
loans outstanding the collectible portion of billed finance charge and fee income on the investors’ interest in securitized loans excluded from loans outstanding
on the “reported” balance sheet in accordance with relevant disclosure guidance.
(2
) The managed loan portfolio does not include auto loans which have been sold in whole loan sale transactions where the Company has retained servicing rights.
V
. Management Summary
S
ummary of the year ended December 31, 2005
The following discussion provides a summary of 2005 results compared to 2004 results and 2004 results compared to 2003
sults. Each component is discussed in further detail in subsequent sections of this analysis. re
ear Ended December 31, 2005 Compared to Year Ended December 31, 2004 Y
Net income increased 17% to $1.8 billion for the year ended December 31, 2005, while diluted earnings per share increased
8% compared to the prior year. The growth in earnings for 2005 was driven by growth in the managed loan portfolio and
contributions from 2005 acquisitions. Earnings per share growth was constrained by the increase in share count as a result of
the issuance of shares in connection with the execution of the forward purchase contracts related to the mandatory convertible
ebt securities and stock option exercise activity. d
Revenue growth was driven by growth in the managed loan portfolio and contributions from 2005 acquisitions. Provision for
loan losses increased due to growth in the reported loan portfolio, estimated losses from the Gulf Coast Hurricanes, and an
increase in net charge-offs resulting from the enactment of the Bankruptcy Abuse Prevention and Consumer Act of 2005
(“new bankruptcy legislation”). Non-interest expense increased in 2005 driven by increases in operating expense. The
increase in operating expense was driven primarily by the 2005 acquisitions, which contributed 86% of the overall increase,
and slightly higher one-time charges in 2005, offset by lower 2005 charges related to the corporate-wide cost initiatives.
Although operating expenses increased for the year, operating expense as a percentage of average managed assets continued
to decline, reflecting the Company’ s improved operating efficiency. The Company’ s return on managed assets of 1.72% is
consistent with prior years and reflects the sustainability and diversification of the Company’ s earnings stream.
The Company continues to achieve strong loan growth in its Auto Finance and Global Financial Services segments, which
accounted for 91% of the loan growth in 2005 and represents 45% of managed loans at December 31, 2005, excluding $16.3
billion in loans added through the Hibernia acquisition. This growth was achieved through organic originations and the
acquisition of Onyx Acceptance Corporation (“Onyx”), a specialty auto loan originator and the Key Bank portfolio which are
included in the Auto Finance segment.
In 2005, the Company expanded its lending and deposit products and its distribution channels while delivering strong results
and maintaining a strong balance sheet. Total assets continue to grow and the Company continues to maintain significant
levels of liquidity. Capital ratios remain well above the regulatory “well capitalized” thresholds following the acquisition of
Hibernia.
31