Capital One 2005 Annual Report Download - page 41
Download and view the complete annual report
Please find page 41 of the 2005 Capital One annual report below. You can navigate through the pages in the report by either clicking on the pages listed below, or by using the keyword search tool below to find specific information within the annual report.-
 1
1 -
2
-
3
-
4
-
5
-
6
-
7
-
8
-
9
-
10
-
11
-
12
-
13
-
14
-
15
-
16
-
17
-
18
-
19
-
20
-
21
-
22
-
23
-
24
-
25
-
26
-
27
-
28
-
29
-
30
-
 31
31 -
 32
32 -
 33
33 -
 34
34 -
 35
35 -
 36
36 -
 37
37 -
 38
38 -
 39
39 -
 40
40 -
 41
41 -
 42
42 -
 43
43 -
 44
44 -
 45
45 -
 46
46 -
 47
47 -
 48
48 -
 49
49 -
 50
50 -
 51
51 -
52
-
53
-
54
-
55
-
56
-
57
-
58
-
59
-
60
-
61
-
62
-
63
-
64
-
65
-
66
-
67
-
68
-
69
-
70
-
71
-
72
-
73
-
74
-
75
-
76
-
77
-
78
-
79
-
80
-
81
-
82
-
83
-
84
-
85
-
86
-
87
-
88
-
89
-
90
-
91
-
92
-
93
-
94
-
95
-
96
-
97
-
98
-
99
-
100
-
101
-
102
-
103
-
104
-
105
-
106
-
107
-
108
-
109
-
110
-
111
-
112
-
113
-
114
-
115
-
116
-
117
-
118
-
119
-
120
-
121
-
122
-
123
-
124
-
125
-
126
-
127
-
128
-
129
 |
 |

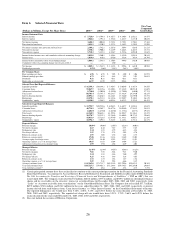
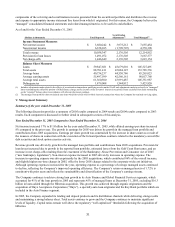
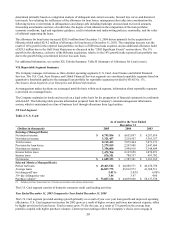
ear Ended December 31, 2004 Compared to Year Ended December 31, 2003 Y
Net income increased 36% over the prior year, while diluted earnings per share increased 28% compared to the prior year.
The growth in earnings for 2004 was primarily driven by an increase in the managed consumer loan portfolio, a reduction in
the provision for loan losses, and an increase in servicing and securitization income and other non-interest income, offset in
part by an increase in marketing and operating expenses.
Managed loans consist of the Company’ s reported loan portfolio combined with the off-balance sheet securitized loan
portfolio. The Company has retained servicing rights for its securitized loans and receives servicing fees in addition to the
excess spread generated from the off-balance sheet loan portfolio. Average managed loans increased 17% for the year ended
December 31, 2004.
The managed net interest margin for the year ended December 31, 2004, decreased 76 basis points. This decrease was due to
a reduction in managed earning asset yields, slightly offset by a reduction in the cost of funds. Managed loan yields decreased
by 83 basis points for the year ended December 31, 2004. The decrease in managed loan yields resulted from the Company’ s
continued asset diversification beyond U.S. consumer credit cards and a bias toward originating higher credit quality, lower
yielding loans. In addition, the Company built the average size of its liquidity portfolio by $3.5 billion, placing additional
downward pressure on managed earning asset yields as the yield on the liquidity portfolio is lower than the yield on
consumer loans.
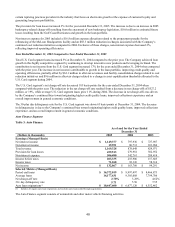
For the year ended December 31, 2004, the provision for loan losses decreased to $1.2 billion from $1.5 billion for the year
ended December 31, 2003. The decrease in the provision for loan losses reflects a reduction in net charge-offs, improving
delinquency rates and lower forecasted charge-offs for the reported loan portfolio at December 31, 2004. The improvements
in the Company’ s credit quality metrics are a result of the continued asset diversification beyond U.S consumer credit cards,
continued bias toward originating higher credit quality, lower yielding loans, improved collection experience and an overall
provement in general economic conditions compared with the prior year. im
Servicing and securitizations income increased $432.1 million as a result of a 16% increase in the average off-balance sheet
loan portfolio for the year ended December 31, 2004 when compared with the prior year, partially offset by a reduction in the
excess spread generated by the off-balance sheet portfolio due to a higher concentration of higher credit quality, lower
yielding loans.
For the year ended December 31, 2004, other non-interest income increased 51%, when compared to the prior year. This
increase is primarily attributable to $72.6 million in pre-tax gains recognized in 2004 on the sale of the Company’ s joint
venture investment in South Africa and sale of the French loan portfolio. The remaining variance is due to increases in
income derived from purchased charged-off loan portfolios, slightly offset by a decrease in auto gains and an increase in
sses on sales of securities available for sale and losses on the repurchases of senior notes during 2004. lo
Marketing expense increased 20% for the year ended December 31, 2004, compared to the prior year. The increase in
marketing expense resulted from favorable opportunities to originate loans during 2004 combined with continued brand
investments. Operating expenses increased 7%, for the year ended December 31, 2004. The increases were primarily related
to charges associated with corporate-wide cost reduction initiatives, charges related to a change in asset capitalization
thresholds and charges related to the impairment of internally developed software. Although operating expenses increased,
operating expenses as a percentage of average managed loans for the year ended December 31, 2004 fell 53 basis points to
5.41% from 5.94% for the prior year. This reduction reflects the continued improvement in the Company’ s operating
efficiencies.
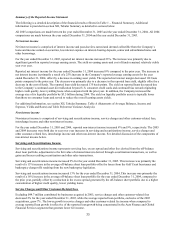
2005 Significant Events
Acquisitions
In November 2005, the Company acquired Hibernia Corporation, a financial holding company headquartered in New
Orleans, Louisiana. As part of the transaction, Hibernia Corporation was merged into the Corporation. Hibernia’ s retail bank
subsidiary, which is now a wholly owned subsidiary of the Corporation, Hibernia National Bank, has over 300 branch
locations operating in Louisiana and Texas. The $5.0 billion acquisition was settled through the issuance of 32.9 million
shares of the Company’ s common stock and $2.2 billion in cash and resulted in $3.2 billion of goodwill.
In the first quarter of 2005, the Company acquired Onyx Acceptance Corporation, a specialty auto loan originator; Hfs
Group, a United Kingdom based home equity broker; InsLogic, an insurance brokerage firm, and eSmartloan, a U.S. based
online originator of home equity loans and mortgages. All were acquired in all cash transactions and resulted in $391.4
32