Capital One 2005 Annual Report Download - page 85
Download and view the complete annual report
Please find page 85 of the 2005 Capital One annual report below. You can navigate through the pages in the report by either clicking on the pages listed below, or by using the keyword search tool below to find specific information within the annual report.-
 1
1 -
2
-
3
-
4
-
5
-
6
-
7
-
8
-
9
-
10
-
11
-
12
-
13
-
14
-
15
-
16
-
17
-
18
-
19
-
20
-
21
-
22
-
23
-
24
-
25
-
26
-
27
-
28
-
29
-
30
-
31
-
32
-
33
-
34
-
35
-
36
-
37
-
38
-
39
-
40
-
41
-
42
-
43
-
44
-
45
-
46
-
47
-
48
-
49
-
50
-
51
-
52
-
53
-
54
-
55
-
56
-
57
-
58
-
59
-
60
-
61
-
62
-
63
-
64
-
65
-
66
-
67
-
68
-
69
-
70
-
71
-
72
-
73
-
74
-
 75
75 -
 76
76 -
 77
77 -
 78
78 -
 79
79 -
 80
80 -
 81
81 -
 82
82 -
 83
83 -
 84
84 -
 85
85 -
 86
86 -
 87
87 -
 88
88 -
 89
89 -
 90
90 -
 91
91 -
 92
92 -
 93
93 -
 94
94 -
 95
95 -
96
-
97
-
98
-
99
-
100
-
101
-
102
-
103
-
104
-
105
-
106
-
107
-
108
-
109
-
110
-
111
-
112
-
113
-
114
-
115
-
116
-
117
-
118
-
119
-
120
-
121
-
122
-
123
-
124
-
125
-
126
-
127
-
128
-
129
 |
 |

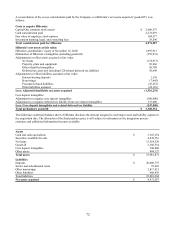
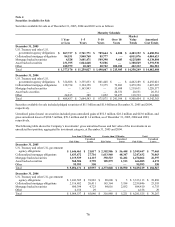
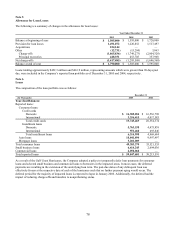
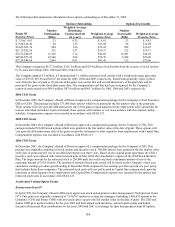
Note 4
S
ecurities Available for Sale
S
ecurities available for sale as of December 31, 2005, 2004 and 2003 were as follows:
Maturity Schedule
1 Year
or Less
1–5
Years
5–10
Years
Over 10
Years
Market
Value
Totals
Amortized
Cost Totals
December 31, 2005
U.S. Treasury and other U.S.
government agency obligations $ 867,737 $ 2,741,771 $ 789,664 $ 4,020 $ 4,403,192 $ 4,480,536
Collateralized mortgage obligations 84,531 3,840,768 85,777 — 4,011,076 4,084,633
Mortgage backed securities 4,528 3,601,471 509,398 9,683 4,125,080 4,138,804
Asset backed securities 231,395 1,064,668 92,506 — 1,388,569 1,391,930
Other 188,979 10,349 20,722 202,282 422,332 386,581
Total $ 1,377,170 $ 11,259,027 $ 1,498,067 $ 215,985 $ 14,350,249 $ 14,482,484
December 31, 2004
U.S. Treasury and other U.S.
government agency obligations $ 324,888 $ 3,335,853 $ 801,448 $ — $ 4,462,189 $ 4,492,021
138,734 3,194,358 73,375 72,883 3,479,350 3,495,207
Mortgage backed securities — 1,163,943 — 55,688 1,219,631 1,220,577
Asset back securities — — — 20,551 20,551 20,532
Other 24,815 389 1,052 92,477 118,733 114,026
Total $ 488,437 $ 7,694,543 $ 875,875 $ 241,599 $ 9,300,454 $ 9,342,363
Securities available for sale included pledged securities of $5.1 billion and $1.6 billion at December 31, 2005 and 2004,
spectively. re
Unrealized gains (losses) on securities included gross unrealized gains of $52.3 million, $28.2 million and $43.0 million, and
gross unrealized losses of $184.5 million, $70.3 million and $11.6 million, as of December 31, 2005, 2004 and 2003,
spectively. re
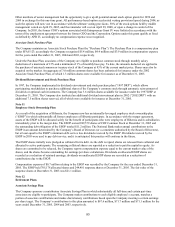
The following table shows the Company’ s investments’ gross unrealized losses and fair value of the investments in an
nrealized loss position, aggregated by investment category, at December 31, 2005 and 2004. u
Less than 12 Months Greater than 12 Months Total
Fair Value Unrealized
Losses Fair Value Unrealized
Losses Fair Value Unrealized
Losses
December 31, 2005
U.S. Treasury and other U.S. government
agency obligations $ 1,646,461 $ 21,017 $ 2,302,986 $ 56,448 $ 3,949,447 $ 77,465
Collateralized mortgage obligations 1,633,672 27,716 1,613,960 48,347 3,247,632 76,063
Mortgage backed securities 1,119,539 14,115 350,523 12,282 1,470,062 26,397
Asset backed securities 560,506 2,759 105,579 1,513 666,085 4,272
Other 95,993 350 — — 95,993 350
Total $ 5,056,171 $ 65,957 $ 4,373,048 $ 118,590 $ 9,429,219 $ 184,547
December 31, 2004
U.S. Treasury and other U.S. government
agency obligations $ 3,243,505 $ 39,883 $ 89,608 $ 5 $ 3,333,113 $ 39,888
Collateralized mortgage obligations 2,116,482 20,411 143,364 3,184 2,259,846 23,595
Mortgage backed securities 600,394 4,723 84,016 2,032 684,410 6,755
Other 4,156 29 — — 4,156 29
Total $ 5,964,537 $ 65,046 $ 316,988 $ 5,221 $ 6,281,525 $ 70,267
76
obligations
Collateralized mortgage