Capital One 2005 Annual Report Download - page 48
Download and view the complete annual report
Please find page 48 of the 2005 Capital One annual report below. You can navigate through the pages in the report by either clicking on the pages listed below, or by using the keyword search tool below to find specific information within the annual report.-
 1
1 -
2
-
3
-
4
-
5
-
6
-
7
-
8
-
9
-
10
-
11
-
12
-
13
-
14
-
15
-
16
-
17
-
18
-
19
-
20
-
21
-
22
-
23
-
24
-
25
-
26
-
27
-
28
-
29
-
30
-
31
-
32
-
33
-
34
-
35
-
36
-
37
-
 38
38 -
 39
39 -
 40
40 -
 41
41 -
 42
42 -
 43
43 -
 44
44 -
 45
45 -
 46
46 -
 47
47 -
 48
48 -
 49
49 -
 50
50 -
 51
51 -
 52
52 -
 53
53 -
 54
54 -
 55
55 -
 56
56 -
 57
57 -
 58
58 -
59
-
60
-
61
-
62
-
63
-
64
-
65
-
66
-
67
-
68
-
69
-
70
-
71
-
72
-
73
-
74
-
75
-
76
-
77
-
78
-
79
-
80
-
81
-
82
-
83
-
84
-
85
-
86
-
87
-
88
-
89
-
90
-
91
-
92
-
93
-
94
-
95
-
96
-
97
-
98
-
99
-
100
-
101
-
102
-
103
-
104
-
105
-
106
-
107
-
108
-
109
-
110
-
111
-
112
-
113
-
114
-
115
-
116
-
117
-
118
-
119
-
120
-
121
-
122
-
123
-
124
-
125
-
126
-
127
-
128
-
129
 |
 |

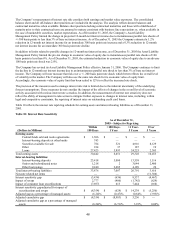
determined primarily based on a migration analysis of delinquent and current accounts, forward loss curves and historical
loss trends. In evaluating the sufficiency of the allowance for loan losses, management also takes into consideration the
following factors: recent trends in delinquencies and charge-offs including bankrupt, deceased and recovered amounts;
forecasting uncertainties and size of credit risks; the degree of risk inherent in the composition of the loan portfolio;
economic conditions; legal and regulatory guidance; credit evaluations and underwriting policies; seasonality; and the value
of collateral supporting the loans.
The allowance for loan losses increased $285.0 million from December 31, 2004 driven primarily by the acquisition of
Hibernia which added $214.2 million of allowance for loan losses at December 31, 2005. The remaining increase was the
result of 14% growth in the reported loan portfolio, exclusive of Hibernia loans acquired, and an additional allowance build
of $28.5 million due to the Gulf Coast Hurricanes as discussed in the “2005 Significant Events” section above. The 5%
growth in the allowance, exclusive of the Hibernia acquisition, relative to the 14% growth in the reported loan portfolio was
due to the growth being concentrated in lower loss auto loans.
For additional information, see section XII, Tabular Summary, Table H (Summary of Allowance for Loan Losses).
V
II. Reportable Segment Summary
The Company manages its business as three distinct operating segments: U.S. Card, Auto Finance and Global Financial
Services. The U.S. Card, Auto Finance and Global Financial Services segments are considered reportable segments based on
quantitative thresholds applied to the managed loan portfolio for reportable segments provided by SFAS No. 131,
Disclosures about Segments of an Enterprise and Related Information.
As management makes decisions on a managed portfolio basis within each segment, information about reportable segments
provided on a managed basis. is
The Company maintains its books and records on a legal entity basis for the preparation of financial statements in conformity
with GAAP. The following table presents information prepared from the Company’ s internal management information
stem, which is maintained on a line of business level through allocations from legal entities. sy
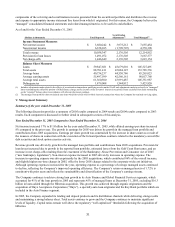
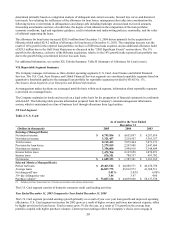
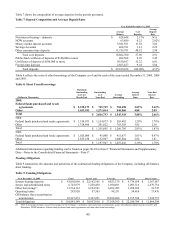
US Card Segment
Table 2: U.S. Card
As of and for the Year Ended
December 31
(Dollars in thousands) 2005 2004 2003
Earnings (Managed Basis)
Net interest income $ 4,793,956 $ 4,655,897 $ 4,287,814
Non-interest income 3,321,457 3,219,567 3,583,357
Total revenue 8,115,413 7,875,464 7,871,171
Provision for loan losses 2,279,109 2,207,888 2,647,406
Non-interest expense 3,356,600 3,499,918 3,348,894
Income before taxes 2,479,704 2,167,658 1,874,871
Income taxes 870,351 780,357 693,702
Net income $ 1,609,353 $ 1,387,301 $ 1,181,169
Selected Metrics (Managed Basis)
Period end loans $ 49,463,522 $ 48,609,571 $ 46,278,750
Average loans 46,827,775 45,812,973 41,308,511
Net charge-off rate 5.01% 5.05% 6.88%
30+ day delinquency rate 3.44 3.97 4.60
Purchase volume(1) $ 73,687,136 $ 64,039,668 $ 58,137,538
) Includes purchase transactions net of returns and excludes cash advance transactions. (1
The U.S. Card segment consists of domestic consumer credit card lending activities.
Year Ended December 31, 2005 Compared to Year Ended December 31, 2004
The U.S. Card segment provided earnings growth primarily as a result of year over year loan growth and improved operating
efficiencies. U.S. Card segment net income for 2005 grew as a result of higher revenue and lower non-interest expense, offset
by higher provision for loan losses. Total revenues grew 3% for the year, as a result of 2% growth in the average loan
portfolio coupled with higher purchase volumes. Current period earnings reflect the Company’ s choice not to engage in
39