Capital One 2005 Annual Report Download - page 92
Download and view the complete annual report
Please find page 92 of the 2005 Capital One annual report below. You can navigate through the pages in the report by either clicking on the pages listed below, or by using the keyword search tool below to find specific information within the annual report.-
 1
1 -
2
-
3
-
4
-
5
-
6
-
7
-
8
-
9
-
10
-
11
-
12
-
13
-
14
-
15
-
16
-
17
-
18
-
19
-
20
-
21
-
22
-
23
-
24
-
25
-
26
-
27
-
28
-
29
-
30
-
31
-
32
-
33
-
34
-
35
-
36
-
37
-
38
-
39
-
40
-
41
-
42
-
43
-
44
-
45
-
46
-
47
-
48
-
49
-
50
-
51
-
52
-
53
-
54
-
55
-
56
-
57
-
58
-
59
-
60
-
61
-
62
-
63
-
64
-
65
-
66
-
67
-
68
-
69
-
70
-
71
-
72
-
73
-
74
-
75
-
76
-
77
-
78
-
79
-
80
-
81
-
 82
82 -
 83
83 -
 84
84 -
 85
85 -
 86
86 -
 87
87 -
 88
88 -
 89
89 -
 90
90 -
 91
91 -
 92
92 -
 93
93 -
 94
94 -
 95
95 -
 96
96 -
 97
97 -
 98
98 -
 99
99 -
 100
100 -
 101
101 -
 102
102 -
103
-
104
-
105
-
106
-
107
-
108
-
109
-
110
-
111
-
112
-
113
-
114
-
115
-
116
-
117
-
118
-
119
-
120
-
121
-
122
-
123
-
124
-
125
-
126
-
127
-
128
-
129
 |
 |

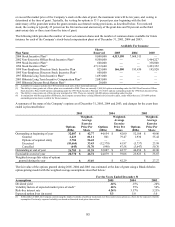
or exceed the market price of the Company’ s stock on the date of grant, the maximum term will be ten years, and vesting is
determined at the time of grant. Typically, the vesting for options is 33 1/3 percent per year beginning with the first
anniversary of the grant date unless the grant contains accelerated vesting provisions, as described below. For restricted
stock, the vesting is typically 25 percent on the first and second anniversary of the grant date and 50 percent on the third
anniversary date or three years from the time of grant.
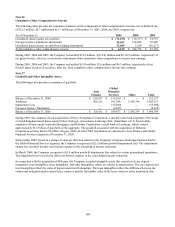
The following table provides the number of reserved common shares and the number of common shares available for future
suance for each of the Company’ s stock-based compensation plans as of December 31, 2005, 2004 and 2003: is
Available For Issuance
Plan Name
Shares
Reserved 2005 2004 2003
2004 Stock Incentive Plan(1) 8,000,000
4,313,190 7,068,515 —
2002 Non-Executive Officer Stock Incentive Plan(2) 8,500,000
— — 1,464,227
1999 Stock Incentive Plan(2) 600,000
— — 338,800
1994 Stock Incentive Plan(2) 67,112,640 — — 1,423,352
1999 Non-Employee Directors Stock Incentive Plan 825,000
166,500 193,430 195,920
1995 Non-Employee Directors Stock Incentive Plan(3) 600,000
— — —
1997 Hibernia Long Term Incentive Plan(4) 1,693,000
— — —
2003 Hibernia Long Term Incentive Compensation Plan(4) 2,083,000
— — —
1993 Hibernia Director Stock Option Plan(4) 20,000
— — —
(1) Available for issuance includes the CEO restricted stock units at their maximum amount.
(2) The ability to issue grants out of these plans was terminated in 2004. There are currently 1,869,364 options outstanding under the 2002 Non-Executive Officer
Stock Incentive Plan, 64,400 options outstanding under the 1999 Stock Incentive Plan and 17,725,435 options outstanding under t e 1994 Stock Incentive Plan. h
(3) The ability to issue grants out of this plan was terminated in 1999. There are currently 164,000 options outstanding under the plan
(4) In conjunction with the acquisition of Hibernia, the Company assumed three existing Hibernia stock incentive plans, under which there are 3,519,086 options
outstanding and no shares available for future issuance.
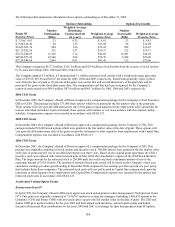
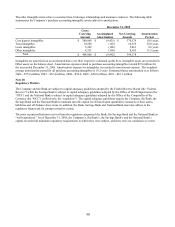
A summary of the status of the Company’ s options as of December 31, 2005, 2004 and 2003, and changes for the years then
nded is presented below: e
2005 2004 2003
Options
(000s)
Weighted-
Average
Exercise
Price Per
Share
Options
(000s)
Weighted-
Average
Exercise
Price Per
Share
Options
(000s)
Weighted-
Average
Exercise
Price Per
Share
Outstanding at beginning of year 32,087 $ 42.77
44,654 $ 42.00 52,108 $ 40.06
Granted 2,223 81.11
801 79.47 1,930 55.42
Options of acquired entity 3,784 56.42
— — — —
Exercised (10,664) 33.43
(12,370) 41.97 (5,737) 23.99
Cancelled (645) 51.70
(998) 47.58 (3,647) 50.76
Outstanding at end of year 26,785 $ 51.39
32,087 $ 42.77 44,654 $ 42.00
Exercisable at end of year 20,770 $ 46.72
24,079 $ 39.06 23,923 $ 35.87
Weighted-average fair value of options
granted during the year $ 37.07
$ 42.29
$ 27.27
The fair value of the options granted during 2005, 2004 and 2003 was estimated at the date of grant using a Black-Scholes
option-pricing model with the weighted average assumptions described below:
For the Years Ended December 31
Assumptions 2005 2004 2003
Dividend yield .14% .15% .24%
Volatility factors of expected market price of stock(1) 46% 55% 54%
Risk-free interest rate 4.26% 3.57% 3.25%
Expected option lives (in years) 5.3 5.8 5.0
(1) In December of 2005, the Company started using the implied volatility of publicly traded and over-the-counter stock options as a basis for the expected volatility
assumption. Previously, expected volatility was based on historical stock price observations.
83