Capital One 2005 Annual Report Download - page 112
Download and view the complete annual report
Please find page 112 of the 2005 Capital One annual report below. You can navigate through the pages in the report by either clicking on the pages listed below, or by using the keyword search tool below to find specific information within the annual report.-
 1
1 -
2
-
3
-
4
-
5
-
6
-
7
-
8
-
9
-
10
-
11
-
12
-
13
-
14
-
15
-
16
-
17
-
18
-
19
-
20
-
21
-
22
-
23
-
24
-
25
-
26
-
27
-
28
-
29
-
30
-
31
-
32
-
33
-
34
-
35
-
36
-
37
-
38
-
39
-
40
-
41
-
42
-
43
-
44
-
45
-
46
-
47
-
48
-
49
-
50
-
51
-
52
-
53
-
54
-
55
-
56
-
57
-
58
-
59
-
60
-
61
-
62
-
63
-
64
-
65
-
66
-
67
-
68
-
69
-
70
-
71
-
72
-
73
-
74
-
75
-
76
-
77
-
78
-
79
-
80
-
81
-
82
-
83
-
84
-
85
-
86
-
87
-
88
-
89
-
90
-
91
-
92
-
93
-
94
-
95
-
96
-
97
-
98
-
99
-
100
-
101
-
 102
102 -
 103
103 -
 104
104 -
 105
105 -
 106
106 -
 107
107 -
 108
108 -
 109
109 -
 110
110 -
 111
111 -
 112
112 -
 113
113 -
 114
114 -
 115
115 -
 116
116 -
 117
117 -
 118
118 -
 119
119 -
 120
120 -
 121
121 -
 122
122 -
123
-
124
-
125
-
126
-
127
-
128
-
129
 |
 |

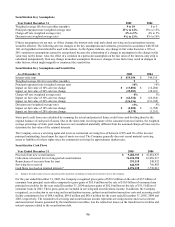
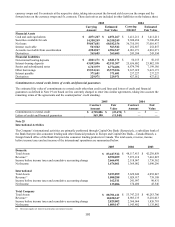
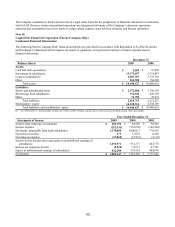
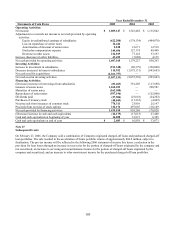
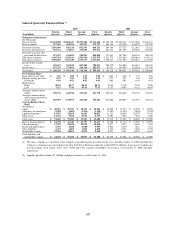
Year Ended December 31
Statements of Cash Flows 2005 2004 2003
Operating Activities:
Net income $ 1,809,147
$ 1,543,482 $ 1,135,842
Adjustments to reconcile net income to net cash provided by operating
activities:
Equity in undistributed earnings of subsidiaries (622,208) (574,134) (404,878)
Loss on repurchase of senior notes 12,444
— —
Amortization of discount of senior notes 2,818
12,671 12,518
Stock plan compensation expense 149,496
127,174 49,449
Decrease in other assets 212,019
77,122 53,197
Increase (decrease) in other liabilities 43,452
(7,088) 4,135
Net cash provided by operating activities 1,607,168
1,179,227 850,263
Investing Activities:
Increase in investment in subsidiaries (911,348) (80,379) (350,000)
Decrease (increase) in loans to subsidiaries 115,952
(1,975,131) (643,603)
Net cash used for acquisitions (2,261,757) — —
Net cash used in investing activities (3,057,153) (2,055,510) (993,603)
Financing Activities:
(81,463)
(Decrease) increase in borrowings from subsidiaries 381,205 (117,698)
Issuance of senior notes 1,262,035
— 298,581
Maturities of senior notes (162,500) — —
Repurchases of senior notes (597,196) — (125,000)
Dividends paid (27,504) (25,618) (24,282)
Purchases of treasury stock (40,049) (17,232) (4,069)
Net proceeds from issuances of common stock 770,311
23,910 25,147
Proceeds from exercise of stock options 312,176
497,003 118,149
Net cash provided by financing activities 1,435,810
859,268 170,828
(Decrease) increase in cash and cash equivalents (14,175) (17,015) 27,488
Cash and cash equivalents at beginning of year 16,858
33,873 6,385
Cash and cash equivalents at end of year $ 2,683
$ 16,858 $ 33,873
Note 27
Subsequent Events
On February 27, 2006, the Company sold a combination of Company originated charged-off loans and purchased charged-off
loan portfolios. The sale resulted in the acceleration of future portfolio returns of approximately $84.0 million, subject to
finalization. The pre-tax income will be reflected in the following 2006 statement of income line items: a reduction in the
provision for loan losses through an increase in recoveries for the portion of charged-off loans originated by the company and
not securitized; an increase to servicing and securitizations income for the portion of charged-off loans originated by the
company and securitized; and an increase to other non-interest income for the purchased charged-off loan portfolios.
103