Capital One 2005 Annual Report Download - page 61
Download and view the complete annual report
Please find page 61 of the 2005 Capital One annual report below. You can navigate through the pages in the report by either clicking on the pages listed below, or by using the keyword search tool below to find specific information within the annual report.-
 1
1 -
2
-
3
-
4
-
5
-
6
-
7
-
8
-
9
-
10
-
11
-
12
-
13
-
14
-
15
-
16
-
17
-
18
-
19
-
20
-
21
-
22
-
23
-
24
-
25
-
26
-
27
-
28
-
29
-
30
-
31
-
32
-
33
-
34
-
35
-
36
-
37
-
38
-
39
-
40
-
41
-
42
-
43
-
44
-
45
-
46
-
47
-
48
-
49
-
50
-
 51
51 -
 52
52 -
 53
53 -
 54
54 -
 55
55 -
 56
56 -
 57
57 -
 58
58 -
 59
59 -
 60
60 -
 61
61 -
 62
62 -
 63
63 -
 64
64 -
 65
65 -
 66
66 -
 67
67 -
 68
68 -
 69
69 -
 70
70 -
 71
71 -
72
-
73
-
74
-
75
-
76
-
77
-
78
-
79
-
80
-
81
-
82
-
83
-
84
-
85
-
86
-
87
-
88
-
89
-
90
-
91
-
92
-
93
-
94
-
95
-
96
-
97
-
98
-
99
-
100
-
101
-
102
-
103
-
104
-
105
-
106
-
107
-
108
-
109
-
110
-
111
-
112
-
113
-
114
-
115
-
116
-
117
-
118
-
119
-
120
-
121
-
122
-
123
-
124
-
125
-
126
-
127
-
128
-
129
 |
 |

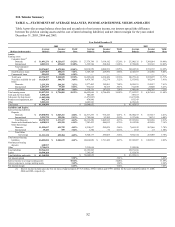
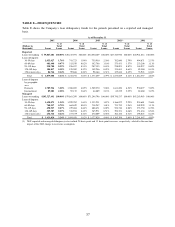
XII. Tabular Summary
TABLE A—STATEMENTS OF AVERAGE BALANCES, INCOME AND EXPENSE, YIELDS AND RATES
Table A provides average balance sheet data and an analysis of net interest income, net interest spread (the difference
between the yield on earning assets and the cost of interest-bearing liabilities) and net interest margin for the years ended
December 31, 2005, 2004 and 2003.
Year Ended December 31
2005 2004 2003
(Doll rs in thousands) a
Average
Balance
Income
/
Expense
Yield
/
Rate
Average
Balance
Income
/
Expense
Yield
/
Rate
Average
Balance
Income
/
Expense
Yield
/
Rate
Assets:
Earning assets
Consumer loa sn
Domestic
(1)
$ 31,891,276 $ 4,226,617 13.25% $ 27,376,799 $ 3,614,142 13.20% $ 23,280,135 $ 3,366,054 14.46%
International 4,083,531 452,652 11.08% 3,539,760 390,384 11.03% 2,754,408 353,301 12.83%
Total consumer
loans 35,974,807 4,679,269 13.01% 30,916,559 4,004,526 12.95% 26,034,543 3,719,355 14.29%
Small business loa s n 4,257,805 298,671 7.01% 3,349,109 229,894 6.86% 2,643,073 212,940 8.06%
Commercia ns l loa
Total loans 501,625 32,899 6.56% — — — — — —
40,734,237 5,010,839 12.30% 34,265,668 4,234,420 12.36% 28,677,616 3,932,295 13.71%
Securities available for sa e l
Other 10,120,453 388,576 3.84% 8,879,785 312,374 3.52% 5,335,492 192,594 3.61%
Domestic 3,235,350
1,407,559 248,281 7.67% 2,577,403 192,901 7.48% 2,836,531 215,957 7.61%
Internationa l
Total Other 79,185 5.63% 932,813 54,725 5.87% 512,658 26,808 5.23%
4,642,909 327,466 7.05% 3,510,216 247,626 7.05% 3,349,189 242,765 7.25%
Total earning assets 55,497,599 $ 5,726,881 10.32% 46,655,669 $ 4,794,420 10.28% 37,362,297 $ 4,367,654 11.69%
Cash and due from banks 1,000,240 506,483
387,167
Allowance for loan losses (1,482,948) (1,473,003) (1,627,020)
Premises and equipment, n
et
Other 842,368
874,960
833,343
5,503,241 4,083,943 4,239,626
Total assets $ 61,360,500
$ 50,648,052
$ 41,195,413
Liabilities and Equity:
Interest-bear g liabilities in
Deposits
Domestic $ 25,838,996 $ 1,043,211 4.04% $ 22,517,293 $ 916,343 4.07% $ 18,550,273
1,217,690 $ 817,515 4.41%
International 2,531,739 129,926 5.13% 1,795,996 93,202 5.19% 74,135 6.09%
Total Deposits 28,370,735 1,173,137 4.14% 24,313,289 1,009,545 4.15% 19,767,963 891,650 4.51%
Senior and subordinated notes
6,820,811 421,218 6.18% 7,203,423 486,812 6.76% 5,915,300 423,826 7.16%
Other borrow s ing
Domestic
11,195,697 451,725 4.03% 8,518,817 295,029 3.46% 7,061,192 267,066 3.78%
International 15,441 559 3.62% 1,360 56 4.12% 1,532 23 1.50%
Total Other
borrowings 11,211,138 452,284 4.03% 8,520,177 295,085 3.46% 7,062,724 267,089 3.78%
Total interest-bearing
liabilities 46,402,684 $ 2,046,639 4.41% 40,036,889 $ 1,791,442 4.47% 32,745,987 $ 1,582,565 4.83%
Non-interest bearing
d its epos
Other 648,917
3,714,631
3,315,616
3,125,956
Total l bilities ia 50,766,232 43,352,505
35,871,943
Equity 10,594,268
7,295,547
5,323,470
Total liabilities and equity $ 61,360,500
$ 50,648,052
$ 41,195,413
Net interest spread
5.91%
5.81%
6.86%
Interest income to average earning assets 10.32% 10.28% 11.69%
Interest expense to average earning assets 3.69%
3.84%
4.24%
Net interest margin
6.63%
6.44%
7.45%
(1) Interest income includes past-due fees on loans of approximately $776.5 million, $792.0 million and $799.3 million for the years ended December 31, 2005,
2004 and 2003, respectively.
52