Capital One 2005 Annual Report Download - page 108
Download and view the complete annual report
Please find page 108 of the 2005 Capital One annual report below. You can navigate through the pages in the report by either clicking on the pages listed below, or by using the keyword search tool below to find specific information within the annual report.-
 1
1 -
2
-
3
-
4
-
5
-
6
-
7
-
8
-
9
-
10
-
11
-
12
-
13
-
14
-
15
-
16
-
17
-
18
-
19
-
20
-
21
-
22
-
23
-
24
-
25
-
26
-
27
-
28
-
29
-
30
-
31
-
32
-
33
-
34
-
35
-
36
-
37
-
38
-
39
-
40
-
41
-
42
-
43
-
44
-
45
-
46
-
47
-
48
-
49
-
50
-
51
-
52
-
53
-
54
-
55
-
56
-
57
-
58
-
59
-
60
-
61
-
62
-
63
-
64
-
65
-
66
-
67
-
68
-
69
-
70
-
71
-
72
-
73
-
74
-
75
-
76
-
77
-
78
-
79
-
80
-
81
-
82
-
83
-
84
-
85
-
86
-
87
-
88
-
89
-
90
-
91
-
92
-
93
-
94
-
95
-
96
-
97
-
 98
98 -
 99
99 -
 100
100 -
 101
101 -
 102
102 -
 103
103 -
 104
104 -
 105
105 -
 106
106 -
 107
107 -
 108
108 -
 109
109 -
 110
110 -
 111
111 -
 112
112 -
 113
113 -
 114
114 -
 115
115 -
 116
116 -
 117
117 -
 118
118 -
119
-
120
-
121
-
122
-
123
-
124
-
125
-
126
-
127
-
128
-
129
 |
 |

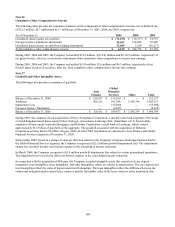
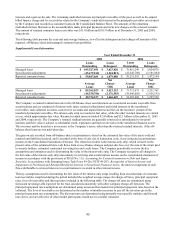
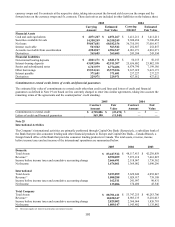
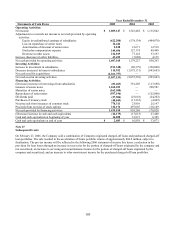
basis. Certain commercial, small business, mortgage and automobile loans require collateral in various forms including cash
eposits, automobiles and real estate, as appropriate. The geographic distribution of the Company’ s loans was as follows: d
December 31
2005 2004
Loans Percentag e
of Total Loans Percentage
of Total
Geographic Region:
Domestic
South $ 44,959,029 42.60% $ 25,034,582 31.34%
West 18,225,986 17.27 15,873,159 19.88
Midwest 17,091,800 16.20 15,220,162 19.06
Northeast 14,601,852 13.84 13,198,619 16.53
Total Domestic 94,878,667 89.91% 69,326,522 86.81%
International
U.K. 8,124,850 7.70% 8,163,109 10.22%
Canada 2,513,936 2.38 2,360,297 2.96
Other 10,038 0.01 11,371 0.01
Total International 10,648,824 10.09% 10,534,777 13.19%
105,527,491 100.00% 79,861,299 100.00%
Less securitization adjustments (45,679,810) (41,645,708)
Total $ 59,847,681
$ 38,215,591
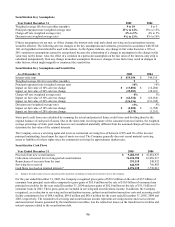
Note 24
D
isclosures About Fair Value of Financial Instruments
The following discloses the fair value of financial instruments whether or not recognized in the balance sheets as of
December 31, 2005 and 2004. In cases where quoted market prices are not available, fair values are based on estimates using
present value or other valuation techniques. Those techniques are significantly affected by the assumptions used, including
the discount rate and estimates of future cash flows. In that regard, the derived fair value estimates cannot be substantiated by
comparison to independent markets and, in many cases, could not be realized in immediate settlement of the instrument. As
required under GAAP, these disclosures exclude certain financial instruments and all non-financial instruments. Accordingly,
e aggregate fair value amounts presented do not represent the underlying value of the Company. th
The Company, in estimating the fair value of its financial instruments as of December 31, 2005 and 2004, used the following
methods and assumptions:
Financial Assets
C
ash and cash equivalents
The carrying amounts of cash and due from banks, federal funds sold and resale agreements and interest-bearing deposits at
other banks approximate fair value.
Securities available for sale
The fair value of securities available for sale was determined using current market prices. See Note 4 for fair values by type
f security. o
Loans
The net carrying amount of credit card loans approximates fair value due to the relatively short average life and variable
terest rates on a substantial number of these loans. This amount excluded any value related to account relationships. in
The fair value of loans other than credit card loans was estimated by discounting future cash flows using a rate at which
similar portfolios of loans would be made under current conditions.
Interest receivable
The carrying amount approximates the fair value of this asset due to its relatively short-term nature.
99