Capital One 2005 Annual Report Download - page 8
Download and view the complete annual report
Please find page 8 of the 2005 Capital One annual report below. You can navigate through the pages in the report by either clicking on the pages listed below, or by using the keyword search tool below to find specific information within the annual report.-
 1
1 -
 2
2 -
 3
3 -
 4
4 -
 5
5 -
 6
6 -
 7
7 -
 8
8 -
 9
9 -
 10
10 -
 11
11 -
 12
12 -
 13
13 -
 14
14 -
 15
15 -
 16
16 -
 17
17 -
 18
18 -
 19
19 -
20
-
21
-
22
-
23
-
24
-
25
-
26
-
27
-
28
-
29
-
30
-
31
-
32
-
33
-
34
-
35
-
36
-
37
-
38
-
39
-
40
-
41
-
42
-
43
-
44
-
45
-
46
-
47
-
48
-
49
-
50
-
51
-
52
-
53
-
54
-
55
-
56
-
57
-
58
-
59
-
60
-
61
-
62
-
63
-
64
-
65
-
66
-
67
-
68
-
69
-
70
-
71
-
72
-
73
-
74
-
75
-
76
-
77
-
78
-
79
-
80
-
81
-
82
-
83
-
84
-
85
-
86
-
87
-
88
-
89
-
90
-
91
-
92
-
93
-
94
-
95
-
96
-
97
-
98
-
99
-
100
-
101
-
102
-
103
-
104
-
105
-
106
-
107
-
108
-
109
-
110
-
111
-
112
-
113
-
114
-
115
-
116
-
117
-
118
-
119
-
120
-
121
-
122
-
123
-
124
-
125
-
126
-
127
-
128
-
129
 |
 |
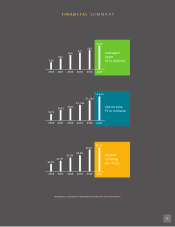
- 7 -
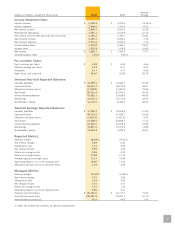
Percent
(Dollars in millions, Except Per Share Data) 2005 2004 Change
Income Statement Data:
Interest income $ 5,726.9 $ 4,794.4 19.45 %
Interest expense 2,046.6 1,791.4 14.25
Net interest income 3,680.3 3,003.0 22.56
Provision for loan losses 1,491.1 1,220.9 22.13
Net interest income after provision for loan losses 2,189.2 1,782.1 22.84
Non-interest income 6,358.1 5,900.2 7.76
Non-interest expense 5,718.3 5,322.2 7.44
Income before taxes 2,829.0 2,360.1 19.87
Income taxes 1,019.9 816.6 24.90
Net income $ 1,809.1 $ 1,543.5 17.21
Dividend payout ratio 1.52 % 1.66 %
Per Common Share:
Basic earnings per share $ 6.98 $ 6.55 6.56
Diluted earnings per share 6.73 6.21 8.37
Dividends 0.11 0.11 0.00
Book value as of year-end 46.97 33.99 38.19
Selected Year-End Reported Balances:
Liquidity portfolio $ 16,399.3 $ 10,384.1 57.93
Consumer loans 59,847.7 38,215.6 56.61
Allowance for loan losses (1,790.0) (1,505.0) 18.94
Total assets 88,701.4 53,747.3 65.03
Interest-bearing deposits 43,092.1 25,636.8 68.09
Borrowings 22,278.1 16,511.8 34.92
Stockholders’ equity 14,128.9 8,388.2 68.44
Selected Average Reported Balances:
Liquidity portfolio $12,792.7 $10,528.6 21.50
Consumer loans 40,734.2 34,265.7 18.88
Allowance for loan losses (1,482.9) (1,473.0) 0.67
Total assets 61,360.5 50,648.1 21.15
Interest-bearing deposits 28,370.7 24,313.3 16.69
Borrowings 18,031.9 15,723.6 14.68
Stockholders’ equity 10,594.3 7,295.5 45.22
Reported Metrics:
Revenue margin 18.09 %19.08 %
Net interest margin 6.63 6.44
Delinquency rate 3.14 3.85
Net charge-off rate 3.55 3.78
Return on average assets 2.95 3.05
Return on average equity 17.08 21.16
Average equity to average assets 17.27 14.40
Operating expense as a % of average loans 10.65 11.63
Allowance for loan losses to consumer loans 2.99 3.94
Managed Metrics:
Revenue margin 12.46 %12.89 %
Net interest margin 7.81 7.88
Delinquency rate 3.24 3.82
Net charge-off rate 4.25 4.41
Return on average assets 1.72 1.73
Operating expense as a % of average loans 5.09 5.41
Average consumer loans $ 85,265.0 $ 73,711.7 15.67
Year-end consumer loans 105,527.5 79,861.3 32.14
Year-end total accounts(1) 49.1 48.6 1.03
(1) Does not include the accounts of Hibernia Corporation.