Capital One 2005 Annual Report Download - page 110
Download and view the complete annual report
Please find page 110 of the 2005 Capital One annual report below. You can navigate through the pages in the report by either clicking on the pages listed below, or by using the keyword search tool below to find specific information within the annual report.-
 1
1 -
2
-
3
-
4
-
5
-
6
-
7
-
8
-
9
-
10
-
11
-
12
-
13
-
14
-
15
-
16
-
17
-
18
-
19
-
20
-
21
-
22
-
23
-
24
-
25
-
26
-
27
-
28
-
29
-
30
-
31
-
32
-
33
-
34
-
35
-
36
-
37
-
38
-
39
-
40
-
41
-
42
-
43
-
44
-
45
-
46
-
47
-
48
-
49
-
50
-
51
-
52
-
53
-
54
-
55
-
56
-
57
-
58
-
59
-
60
-
61
-
62
-
63
-
64
-
65
-
66
-
67
-
68
-
69
-
70
-
71
-
72
-
73
-
74
-
75
-
76
-
77
-
78
-
79
-
80
-
81
-
82
-
83
-
84
-
85
-
86
-
87
-
88
-
89
-
90
-
91
-
92
-
93
-
94
-
95
-
96
-
97
-
98
-
99
-
 100
100 -
 101
101 -
 102
102 -
 103
103 -
 104
104 -
 105
105 -
 106
106 -
 107
107 -
 108
108 -
 109
109 -
 110
110 -
 111
111 -
 112
112 -
 113
113 -
 114
114 -
 115
115 -
 116
116 -
 117
117 -
 118
118 -
 119
119 -
 120
120 -
121
-
122
-
123
-
124
-
125
-
126
-
127
-
128
-
129
 |
 |

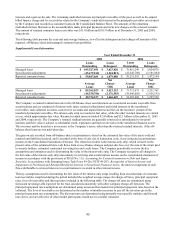
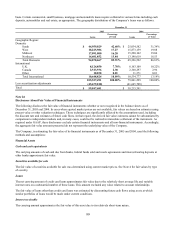
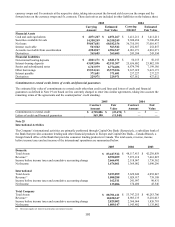
currency swaps and f/x contracts at the respective dates, taking into account the forward yield curve on the swaps and the
rward rates on the currency swaps and f/x contracts. These derivatives are included in other liabilities on the balance sheet. fo
2005 2004
Carrying
Amount
Estimated
Fair Value
Carrying
Amount Estimated
Fair Value
Financial Assets
Cash and cash equivalents $ 4,071,267 $ 4,071,267
$ 1,411,211 $ 1,411,211
Securities available for sale 14,350,249 14,350,249
9,300,454 9,300,454
Net loans 59,847,681 60,182,156
36,710,591 37,010,417
Interest receivable 563,542 563,542
252,857 252,857
Accounts receivable from securitization 4,904,547 4,904,547
4,081,271 4,081,271
Derivatives 265,685 265,685
243,594 243,594
Financial Liabilities
Non-interest bearing deposits $ 4,841,171 $ 4,841,171 $ 50,155 $ 50,155
Interest-bearing deposits 43,092,096 42,911,307
25,636,802 25,882,189
Senior and subordinated notes 6,743,979 6,774,486
6,874,790 7,199,186
Other borrowings 15,534,161 15,575,106
9,637,019 9,621,173
Interest payable 371,681 371,681
237,227 237,227
Derivatives 229,971 229,971
427,012 427,012
Commitments to extend credit, letters of credit, and financial guarantees
The estimated fair value of commitments to extend credit other than credit card lines and letters of credit and financial
guarantees as defined in Note 19 are based on fees currently charged to enter into similar agreements, taking into account the
remaining terms of the agreements and the counterparties’ credit standing.
2005 2004
Contract
Amount
Fair
Value
Contract
Amount
Fair
Value
Commitments to extend credit $ 4,718,806 $ (23,674) $ — $ —
Letters of credit and financial guarantees 569,190 (11,545) — —
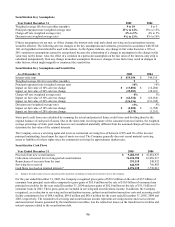
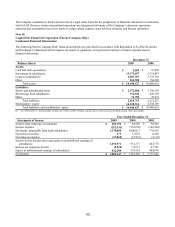
Note 25
International Activities
The Company’ s international activities are primarily performed through Capital One Bank (Europe) plc, a subsidiary bank of
the Bank that provides consumer lending and other financial products in Europe and Capital One Bank—Canada Branch, a
foreign branch office of the Bank that provides consumer lending products in Canada. The total assets, revenue, income
efore income taxes and net income of the international operations are summarized below. b
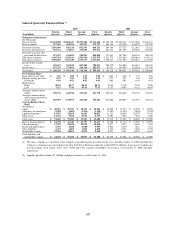
2005 2004 2003
Domestic
Total Assets $ 83,447,512 $ 48,117,413 $ 42,230,859
Revenue(1) 8,950,059
7,873,218 7,461,825
Income before income taxes and cumulative accounting change 2,666,491
2,118,067 1,736,362
Net Income 1,674,061
1,369,082 1,090,296
International
Total Assets 5,253,899
5,629,842 4,052,847
Revenue(1) 1,088,288
1,029,917 739,188
Income before income taxes and cumulative accounting change 162,511
241,997 90,431
Net Income 135,086
174,400 45,546
Total Company
Total Assets $ 88,701,411 $ 53,747,255 $ 46,283,706
Revenue(1) 10,038,347
8,903,135 8,201,013
Income before income taxes and cumulative accounting change 2,829,002
2,360,064 1,826,793
Net Income 1,809,147
1,543,482 1,135,842
101
(1
) Revenue equals net interest income plus non-interest income.