Capital One 2005 Annual Report Download - page 43
Download and view the complete annual report
Please find page 43 of the 2005 Capital One annual report below. You can navigate through the pages in the report by either clicking on the pages listed below, or by using the keyword search tool below to find specific information within the annual report.-
 1
1 -
2
-
3
-
4
-
5
-
6
-
7
-
8
-
9
-
10
-
11
-
12
-
13
-
14
-
15
-
16
-
17
-
18
-
19
-
20
-
21
-
22
-
23
-
24
-
25
-
26
-
27
-
28
-
29
-
30
-
31
-
32
-
 33
33 -
 34
34 -
 35
35 -
 36
36 -
 37
37 -
 38
38 -
 39
39 -
 40
40 -
 41
41 -
 42
42 -
 43
43 -
 44
44 -
 45
45 -
 46
46 -
 47
47 -
 48
48 -
 49
49 -
 50
50 -
 51
51 -
 52
52 -
 53
53 -
54
-
55
-
56
-
57
-
58
-
59
-
60
-
61
-
62
-
63
-
64
-
65
-
66
-
67
-
68
-
69
-
70
-
71
-
72
-
73
-
74
-
75
-
76
-
77
-
78
-
79
-
80
-
81
-
82
-
83
-
84
-
85
-
86
-
87
-
88
-
89
-
90
-
91
-
92
-
93
-
94
-
95
-
96
-
97
-
98
-
99
-
100
-
101
-
102
-
103
-
104
-
105
-
106
-
107
-
108
-
109
-
110
-
111
-
112
-
113
-
114
-
115
-
116
-
117
-
118
-
119
-
120
-
121
-
122
-
123
-
124
-
125
-
126
-
127
-
128
-
129
 |
 |

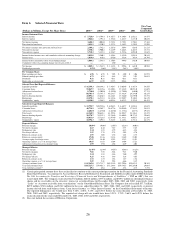
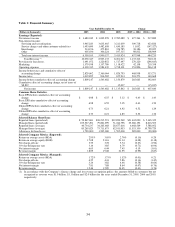
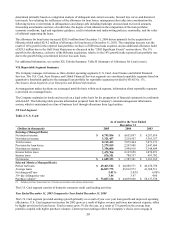
Table 1: Financial Summary
Year Ended December 31 Change
(Dollars in thousands) 2005 2004 2003 2005 vs. 2004 2004 vs. 2003
Earnings (Reported):
Net interest income $ 3,680,242 $ 3,002,978 $ 2,785,089 $ 677,264 $ 217,889
Non-interest income:
Servicing and securitizations 3,945,183 3,635,465 3,211,639 309,718 423,826
Service charges and other customer-related fees 1,493,690 1,482,658 1,630,185 11,032 (147,527)
Interchange 514,196 475,810 376,785 38,386 99,025
Other 405,036 306,224 197,315 98,812 108,909
Total non-interest income 6,358,105 5,900,157 5,415,924 457,948 484,233
Total Revenue (1) 10,038,347 8,903,135 8,201,013 1,135,212 702,122
Provision for loan losses 1,491,072 1,220,852 1,517,497 270,220 (296,645)
Marketing 1,379,938 1,337,780 1,118,422 42,158 219,358
Operating expenses 4,338,335 3,984,439 3,738,301 353,896 246,138
Income before taxes and cumulative effect of
accounting change 2,829,002 2,360,064 1,826,793 468,938 533,271
Income taxes 1,019,855 816,582 675,914 203,273 140,668
Income before cumulative effect of accounting change 1,809,147 1,543,482 1,150,879 265,665 392,603
Cumulative effect of accounting change, net of taxes of
$8,832 — — 15,037 — (15,037)
Net income $ 1,809,147 $ 1,543,482 $ 1,135,842 $ 265,665 $ 407,640
Common Share Statistics:
Basic EPS before cumulative effect of accounting
change $ 6.98 $ 6.55 $ 5.12 $ 0.43 $ 1.43
Basic EPS after cumulative effect of accounting
change 6.98 6.55 5.05 0.43 1.50
Diluted EPS before cumulative effect of accounting
change 6.73 6.21 4.92 0.52 1.29
Diluted EPS after cumulative effect of accounting
change 6.73 6.21 4.85 0.52 1.36
Selected Balance Sheet Data:
Reported loans (period end) $ 59,847,681 $38,215,591 $32,850,269 $21,632,090 $ 5,365,322
Managed loans (period end) 105,527,491 79,861,299 71,244,796 25,666,192 8,616,503
Reported loans (average) 40,734,237 34,265,668 28,677,616 6,468,569 5,588,052
Managed loans (average) 85,265,023 73,711,673 62,911,953 11,553,350 10,799,720
Allowance for loan losses 1,790,000 1,505,000 1,595,000 285,000 (90,000)
Selected Company Metrics (Reported):
Return on average assets (ROA) 2.95% 3.05% 2.76% (0.10) 0.29
Return on average equity (ROE) 17.08 21.16 21.34 (4.08) (0.18)
Net charge-off rate 3.55 3.78 5.74 (0.23) (1.96)
30+ day delinquency rate 3.14 3.85 4.79 (0.71) (0.94)
Net interest margin 6.63 6.44 7.45 0.19 (1.01)
Revenue margin 18.09 19.08 21.95 (0.99) (2.87)
Selected Company Metrics (Managed):
Return on average assets (ROA) 1.72% 1.73% 1.52% (0.01) 0.21
Net charge-off rate 4.25 4.41 5.86 (0.16) (1.45)
30+ day delinquency rate 3.24 3.82 4.46 (0.58) (0.64)
Net interest margin 7.81 7.88 8.64 (0.07) (0.76)
Revenue margin 12.46 12.89 14.65 (0.43) (1.76)
(1) In accordance with the Company’s finance charge and fee revenue recognition policy, the amounts billed to customers but not
recognized as revenue were $1.0 billion, $1.1 billion and $2.0 billion for the years ended December 31, 2005, 2004 and 2003,
respectively.
34