Capital One 2005 Annual Report Download - page 116
Download and view the complete annual report
Please find page 116 of the 2005 Capital One annual report below. You can navigate through the pages in the report by either clicking on the pages listed below, or by using the keyword search tool below to find specific information within the annual report.-
 1
1 -
2
-
3
-
4
-
5
-
6
-
7
-
8
-
9
-
10
-
11
-
12
-
13
-
14
-
15
-
16
-
17
-
18
-
19
-
20
-
21
-
22
-
23
-
24
-
25
-
26
-
27
-
28
-
29
-
30
-
31
-
32
-
33
-
34
-
35
-
36
-
37
-
38
-
39
-
40
-
41
-
42
-
43
-
44
-
45
-
46
-
47
-
48
-
49
-
50
-
51
-
52
-
53
-
54
-
55
-
56
-
57
-
58
-
59
-
60
-
61
-
62
-
63
-
64
-
65
-
66
-
67
-
68
-
69
-
70
-
71
-
72
-
73
-
74
-
75
-
76
-
77
-
78
-
79
-
80
-
81
-
82
-
83
-
84
-
85
-
86
-
87
-
88
-
89
-
90
-
91
-
92
-
93
-
94
-
95
-
96
-
97
-
98
-
99
-
100
-
101
-
102
-
103
-
104
-
105
-
 106
106 -
 107
107 -
 108
108 -
 109
109 -
 110
110 -
 111
111 -
 112
112 -
 113
113 -
 114
114 -
 115
115 -
 116
116 -
 117
117 -
 118
118 -
 119
119 -
 120
120 -
 121
121 -
 122
122 -
 123
123 -
 124
124 -
 125
125 -
 126
126 -
127
-
128
-
129
 |
 |

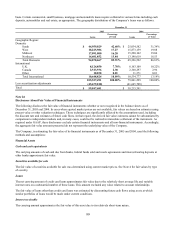
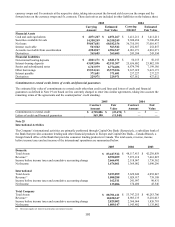
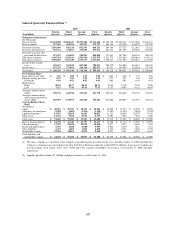
Selected Quarterly Financial Data (1)
2005 2004
(Unaudited)
Fourth
Quarter
Third
Quarter
Second
Quarter
First
Quarter
Fourth
Quarter
Third
Quarter
Second
Quarter
First
Quarter
Summary of Operations:
(In Thousands)
Interest income $1,634,098 $1,404,615 $1,351,900 $1,336,268 $1,249,330 $1,228,413 $1,151,946 $1,164,731
Interest expense 597,099 494,396 479,397 475,747 464,766 453,038 440,929 432,709
Net interest income 1,036,999 910,219 872,503 860,521 784,564 775,375 711,017 732,022
Provision for loan losses 565,674 374,167 291,600 259,631 467,133 267,795 242,256 243,668
Net interest income after
provision for loan losses 471,325 536,052 580,903 600,890 317,431 507,580 468,761 488,354
Non-interest income 1,665,514 1,594,616 1,581,996 1,515,979 1,521,575 1,539,384 1,396,064 1,443,134
Non-interest expense 1,689,186 1,365,638 1,335,617 1,327,832 1,556,527 1,311,984 1,228,812 1,224,896
Income before income
taxes 447,653 765,030 827,282 789,037 282,479 734,980 636,013 706,592
Income taxes 167,335 273,881 296,164 282,475 87,351 244,819 228,626 255,786
Net income $ 280,318 $ 491,149 $ 531,118 $ 506,562 $ 195,128 $ 490,161 $ 407,387 $ 450,806
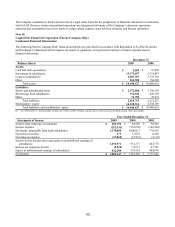
Per Common Share:
Basic earnings per share $ 1.01 $ 1.88 $ 2.10 2.08 $ 0.82 $ 2.07 $ 1.74 1.94
Diluted earnings per share 0.97 1.81 2.03 1.99 0.77 1.97 1.65 1.84
Dividends 0.03 0.03 0.03 0.03 0.03 0.03 0.03 0.03
Market prices
High 88.56 85.97 80.42 84.75 84.45 75.49 77.65 76.66
Low 71.15 77.89 69.10 73.15 67.62 64.93 61.15 60.04
Average common shares
(000s) 278,752 260,918 252,585 243,978 239,247 236,405 234,732 232,021
Average common shares
and common equivalent
shares (000s) 287,694 270,693 261,664 255,181 253,008 249,007 247,591 245,413
Average Balance Sheet
Data:
(In Millions)
Loans $ 48,701 $ 38,556 $ 38,237 $ 38,204 $ 36,096 $ 34,772 $ 33,290 $ 32,878
Allowance for loan losses (1,585) (1,405) (1,439) (1,510) (1,381) (1,425) (1,494) (1,594)
Liquidity Portfolio (2) 15,855 12,869 11,603 10,825 11,531 10,646 10,578 9,347
Other assets 11,472 9,184 8,562 8,769 7,093 7,503 7,646 7,068
Total assets $ 74,443 $ 59,204 $ 56,963 $ 56,288 $ 53,339 $ 51,496 $ 50,020 $ 47,699
Interest-bearing deposits $ 34,738 $ 26,618 $ 26,391 $ 25,655 $ 25,580 $ 24,714 $ 23,948 $ 22,993
Other borrowings 13,703 10,698 10,839 10,698 9,077 8,675 8,488 7,834
Senior and deposit notes 6,707 6,684 6,988 6,909 6,946 7,219 7,381 7,271
Other liabilities 6,767 4,402 3,820 4,458 3,515 3,327 3,260 3,158
Stockholder’s equity 12,528 10,802 8,925 8,568 8,221 7,561 6,943 6,443
Total liabilities and
stockholders’ equity $ 74,443 $ 59,204 $ 56,963 $ 56,288 $ 53,339 $ 51,496 $ 50,020 $ 47,699
(1) The above schedule is a tabulation of the Company’s unaudited quarterly results for the years ended December 31, 2005 and 2004. The
Company’s common shares are traded on the New York Stock Exchange under the symbol COF. In addition, shares may be traded in the
over-the-counter stock market. There were 11,856 and 9,721 common stockholders of record as of December 31, 2005 and 2004,
respectively.
(2) Liquidity portfolio includes $5.1 billion of pledged securities as of December 31, 2005.
107