Capital One 2005 Annual Report Download - page 72
Download and view the complete annual report
Please find page 72 of the 2005 Capital One annual report below. You can navigate through the pages in the report by either clicking on the pages listed below, or by using the keyword search tool below to find specific information within the annual report.-
 1
1 -
2
-
3
-
4
-
5
-
6
-
7
-
8
-
9
-
10
-
11
-
12
-
13
-
14
-
15
-
16
-
17
-
18
-
19
-
20
-
21
-
22
-
23
-
24
-
25
-
26
-
27
-
28
-
29
-
30
-
31
-
32
-
33
-
34
-
35
-
36
-
37
-
38
-
39
-
40
-
41
-
42
-
43
-
44
-
45
-
46
-
47
-
48
-
49
-
50
-
51
-
52
-
53
-
54
-
55
-
56
-
57
-
58
-
59
-
60
-
61
-
 62
62 -
 63
63 -
 64
64 -
 65
65 -
 66
66 -
 67
67 -
 68
68 -
 69
69 -
 70
70 -
 71
71 -
 72
72 -
 73
73 -
 74
74 -
 75
75 -
 76
76 -
 77
77 -
 78
78 -
 79
79 -
 80
80 -
 81
81 -
 82
82 -
83
-
84
-
85
-
86
-
87
-
88
-
89
-
90
-
91
-
92
-
93
-
94
-
95
-
96
-
97
-
98
-
99
-
100
-
101
-
102
-
103
-
104
-
105
-
106
-
107
-
108
-
109
-
110
-
111
-
112
-
113
-
114
-
115
-
116
-
117
-
118
-
119
-
120
-
121
-
122
-
123
-
124
-
125
-
126
-
127
-
128
-
129
 |
 |

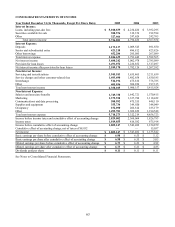
CONSOLIDATED STATEMENTS OF INCOME
Year Ended December 31 (In Thousands, Except Per Share Data)
2005
2004 2003
Interest Income:
Loans, including past-due fees $ 5,010,839 $ 4,234,420 $ 3,932,295
Securities available for sale 388,576
312,374 192,594
Other 327,466
247,626 242,765
Total interest income 5,726,881
4,794,420 4,367,654
Interest Expense:
Deposits 1,173,137
1,009,545 891,650
Senior and subordinated notes 421,218
486,812 423,826
Other borrowings 452,284
295,085 267,089
Total interest expense 2,046,639
1,791,442 1,582,565
Net interest income 3,680,242
3,002,978 2,785,089
Provision for loan losses 1,491,072
1,220,852 1,517,497
Net interest income after provision for loan losses 2,189,170
1,782,126 1,267,592
Non-Interest Income:
Servicing and securitizations 3,945,183
3,635,465 3,211,639
Service charges and other customer-related fees 1,493,690
1,482,658 1,630,185
Interchange 514,196
475,810 376,785
Other 405,036
306,224 197,315
Total non-interest income 6,358,105
5,900,157 5,415,924
Non-Interest Expense:
Salaries and associate benefits 1,749,738
1,642,721 1,570,415
Marketing 1,379,938
1,337,780 1,118,422
Communications and data processing 580,992
475,355 448,110
Supplies and equipment 355,734
349,920 344,049
Occupancy 152,090
206,614 185,179
Other 1,499,781
1,309,829 1,190,548
Total non-interest expense 5,718,273
5,322,219 4,856,723
Income before income taxes and cumulative effect of accounting change 2,829,002
2,360,064 1,826,793
Income taxes 1,019,855
816,582 675,914
Income before cumulative effect of accounting change 1,809,147
1,543,482 1,150,879
Cumulative effect of accounting change, net of taxes of $8,832 —
— 15,037
Net income $ 1,809,147 $ 1,543,482 $ 1,135,842
Basic earnings per share before cumulative effect of accounting change $ 6.98
$ 6.55 $ 5.12
Basic earnings per share after cumulative effect of accounting change $ 6.98
$ 6.55 $ 5.05
Diluted earnings per share before cumulative effect of accounting change $ 6.73
$ 6.21 $ 4.92
Diluted earnings per share after cumulative effect of accounting change $ 6.73
$ 6.21 $ 4.85
Dividends paid per share $ 0.11
$ 0.11 $ 0.11
See Notes to Consolidated Financial Statements.
63