Capital One 2005 Annual Report Download - page 57
Download and view the complete annual report
Please find page 57 of the 2005 Capital One annual report below. You can navigate through the pages in the report by either clicking on the pages listed below, or by using the keyword search tool below to find specific information within the annual report.-
 1
1 -
2
-
3
-
4
-
5
-
6
-
7
-
8
-
9
-
10
-
11
-
12
-
13
-
14
-
15
-
16
-
17
-
18
-
19
-
20
-
21
-
22
-
23
-
24
-
25
-
26
-
27
-
28
-
29
-
30
-
31
-
32
-
33
-
34
-
35
-
36
-
37
-
38
-
39
-
40
-
41
-
42
-
43
-
44
-
45
-
46
-
 47
47 -
 48
48 -
 49
49 -
 50
50 -
 51
51 -
 52
52 -
 53
53 -
 54
54 -
 55
55 -
 56
56 -
 57
57 -
 58
58 -
 59
59 -
 60
60 -
 61
61 -
 62
62 -
 63
63 -
 64
64 -
 65
65 -
 66
66 -
 67
67 -
68
-
69
-
70
-
71
-
72
-
73
-
74
-
75
-
76
-
77
-
78
-
79
-
80
-
81
-
82
-
83
-
84
-
85
-
86
-
87
-
88
-
89
-
90
-
91
-
92
-
93
-
94
-
95
-
96
-
97
-
98
-
99
-
100
-
101
-
102
-
103
-
104
-
105
-
106
-
107
-
108
-
109
-
110
-
111
-
112
-
113
-
114
-
115
-
116
-
117
-
118
-
119
-
120
-
121
-
122
-
123
-
124
-
125
-
126
-
127
-
128
-
129
 |
 |

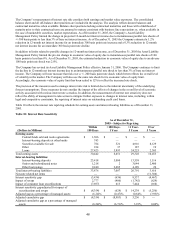
The Company’ s measurement of interest rate risk considers both earnings and market value exposures. The consolidated
balance sheet and all off-balance sheet positions are included in the analysis. The analysis reflects known balances and
contractual maturities when available. Balance sheet positions lacking contractual maturities and those with a likelihood of
maturity prior to their contractual term are assumed to mature consistent with business line expectations or, when available in
the case of marketable securities, market expectations. As of December 31, 2005, the Company’ s Asset/Liability
Management Policy limited the change in projected 12-month net interest income due to instantaneous parallel rate shocks of
+/-300 basis points to less than 3% of base net interest income. As of December 31, 2005 the Company estimated a 1.2%
reduction in 12-month net interest income for an immediate 300 basis point rate increase and a 0.3% reduction in 12-month
et interest income for an immediate 300 basis point rate decline. n
In addition to limits related to possible changes in 12-month net interest income, as of December 31, 2005 the Asset/Liability
Management Policy limited the pre-tax change in economic value of equity due to instantaneous parallel rate shocks of 100
basis points to less than 6%. As of December 31, 2005, the estimated reduction in economic value of equity due to an adverse
100 basis point rate shock was 2.8%.
The Company has revised its Asset/Liability Management Policy effective January 31, 2006. The Company continues to limit
the decline in 12-month net interest income due to an instantaneous parallel rate shock to less than 3% of base net interest
income. The Company will now measure that risk over a +/- 200 basis point rate shock which better reflects the overall level
of volatility in the market. The Company will also use the same rate shock for its economic value of equity limit.
ccordingly, the economic value of equity limit has been scaled to 12% to reflect the increased rate shock. A
The precision of the measures used to manage interest rate risk is limited due to the inherent uncertainty of the underlying
forecast assumptions. These measures do not consider the impact of the effects of changes in the overall level of economic
activity associated with various interest rate scenarios. In addition, the measurement of interest rate sensitivity does not
reflect the ability of management to take action to mitigate further exposure to changes in interest rates, including, within
gal and competitive constraints, the repricing of interest rates on outstanding credit card loans. le
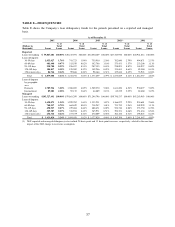
Table 10 reflects the interest rate repricing schedule for earning assets and interest-bearing liabilities as of December 31,
2005.
Table 10: Interest Rate Sensitivity
As of December 31,
2005—Subject to Repricing
(Dollars in Millions)
Within
180 Days
>180 Days-
1 Year
>1 Year-
5 Years
Over
5 Years
Earning assets:
Federal funds sold and resale agreements $ 1,306 $ — $ — $ —
Interest-bearing deposits at other banks 743 — — —
Securities available for sale 784 521 4,916 8,129
Other 184 37 187 19
Loans 27,425 5,893 24,225 2,305
Total earning assets 30,442 6,451 29,328 10,453
Interest-bearing liabilities:
23,418
5,000
13,558
1,116 Interest-bearing deposits
Senior and subordinated notes 1,218 2 3,044 2,480
Other borrowings 9,240 2,085 4,189 20
Total interest-bearing liabilities 33,876 7,087 20,791 3,616
Non-rate related net items — — — (11,304)
Interest sensitivity gap (3,434) (636) 8,537 (4,467)
Impact of swaps 2,777 (406) (1,742) (629)
Impact of consumer loan securitizations (7,697) 413 7,444 (160)
Interest sensitivity gap adjusted for impact of
securitizations and swaps $ (8,354) $ (629) $ 14,239 $ (5,256)
Adjusted gap as a percentage of managed assets (6.24)% (0.47)% 10.64% (3.93)%
Adjusted cumulative gap $ (8,354) $ (8,983) $ 5,256 $ —
Adjusted cumulative gap as a percentage of managed
assets (6.24)% (6.71)% 3.93% 0.00%
48