Capital One 2005 Annual Report Download - page 46
Download and view the complete annual report
Please find page 46 of the 2005 Capital One annual report below. You can navigate through the pages in the report by either clicking on the pages listed below, or by using the keyword search tool below to find specific information within the annual report.-
 1
1 -
2
-
3
-
4
-
5
-
6
-
7
-
8
-
9
-
10
-
11
-
12
-
13
-
14
-
15
-
16
-
17
-
18
-
19
-
20
-
21
-
22
-
23
-
24
-
25
-
26
-
27
-
28
-
29
-
30
-
31
-
32
-
33
-
34
-
35
-
 36
36 -
 37
37 -
 38
38 -
 39
39 -
 40
40 -
 41
41 -
 42
42 -
 43
43 -
 44
44 -
 45
45 -
 46
46 -
 47
47 -
 48
48 -
 49
49 -
 50
50 -
 51
51 -
 52
52 -
 53
53 -
 54
54 -
 55
55 -
 56
56 -
57
-
58
-
59
-
60
-
61
-
62
-
63
-
64
-
65
-
66
-
67
-
68
-
69
-
70
-
71
-
72
-
73
-
74
-
75
-
76
-
77
-
78
-
79
-
80
-
81
-
82
-
83
-
84
-
85
-
86
-
87
-
88
-
89
-
90
-
91
-
92
-
93
-
94
-
95
-
96
-
97
-
98
-
99
-
100
-
101
-
102
-
103
-
104
-
105
-
106
-
107
-
108
-
109
-
110
-
111
-
112
-
113
-
114
-
115
-
116
-
117
-
118
-
119
-
120
-
121
-
122
-
123
-
124
-
125
-
126
-
127
-
128
-
129
 |
 |

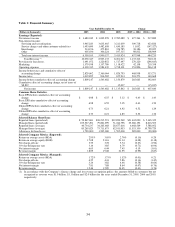
Non-interest expense increased 7% for the year ended December 31, 2005, reflecting flat marketing spend and a 9% increase
in operating expenses. The increase in operating expenses was driven primarily by the 2005 acquisitions and slightly higher
2005 one-time charges, offset by lower 2005 charges related to the company’ s corporate-wide cost reduction initiatives
announced in 2004. Companies acquired in 2005 contributed $303.8 million in operating expenses or 86% of the overall
increase. In addition, the company recognized a $20.6 million pre-payment penalty related to the refinancing of the McLean
headquarters facility and a $28.2 million impairment charge related to its Global Financial Services segment insurance
brokerage business compared to a total of $36.4 million in 2004 one-time charges detailed below. 2005 operating expenses
were positively impacted by a $67.3 million reduction in employee termination benefits and facility consolidation costs
related to corporate-wide cost reduction initiatives. Excluding the aforementioned items, operating expenses increased 2% for
the year ended December 31, 2005. This increase was the result of 7% managed loan growth, excluding 2005 acquisitions,
and reflects improved operating efficiencies. Operating expenses as a percentage of average managed assets for the year
ended December 31, 2005 fell 33 basis points to 4.12% from 4.45% for the prior year.
Non-interest expense increased 10% for the year ended December 31, 2004. Marketing expense increased 20% for the year
ended December 31, 2004. The increase in marketing expense is the result of favorable opportunities to originate loans
during 2004 combined with continued brand investments. Operating expenses were $4.0 billion for the year ended
December 31, 2004, compared to $3.7 billion for December 31, 2003. The increase in operating expense of $246.1 was
primarily due to $161.2 million in pre-tax charges consisting of $124.8 million in employee termination benefits and facility
consolidation costs related to corporate-wide cost reduction initiatives, $20.6 million related to a change in asset
capitalization thresholds and $15.8 million related to impairment of internally developed software. Additionally, a $41.8
million increase in professional services expense and a $50.5 million increase in expenses related to credit recovery efforts
contributed to the increase in operating expense for the year ended December 31, 2004 when compared with the prior year.
Although operating expenses increased, operating expenses as a percentage of average managed loans for the year ended
December 31, 2004 fell 53 basis points to 5.41% from 5.94% for the prior year. This reduction reflects the continued
provement in the Company’ s operating efficiencies.
im
Income taxes
The Company’ s effective tax rate was 36.1%, 34.6% and 37% for the years ended December 31, 2005, 2004 and 2003,
respectively. The effective rate includes state, federal and international income tax components. The increase in the 2005 rate
compared to 2004 was primarily driven by changes in the Company’ s international tax positions. The decrease in the 2004
tax rate compared to 2003 was primarily due to increased profitability in the Company’ s international businesses which are in
lower taxed territories, investment in synthetic fuel credits and ongoing tax planning activities.
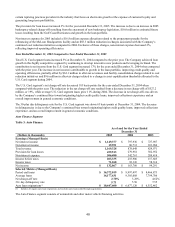
Loan Portfolio Summary
The Company analyzes its financial performance on a managed loan portfolio basis. The managed loan portfolio is comprised
of on-balance sheet and off-balance sheet loans. The Company has retained servicing rights for its securitized loans and
receives servicing fees in addition to the excess spread generated from the off-balance sheet loan portfolio.
Average managed loans grew 16% and 17% for the years ended December 31, 2005 and 2004, respectively. 2004 growth was
distributed across all segments while average managed loan growth in 2005 was primarily due to growth in Auto Finance and
lobal Financial Services. G
F
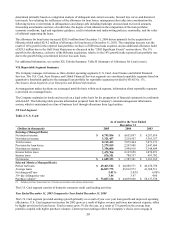
or additional information, see section XII, Tabular Summary, Table C (Managed Consumer Loan Portfolio).
A
sset Quality
The Company’ s credit risk profile is managed to maintain strong risk adjusted returns and diversification across the full credit
spectrum and in each of its lending products. Certain lending products have, in some cases, higher expected delinquencies
and charge-off rates. The costs associated with higher delinquency and charge-off rates are considered in the pricing of
individual products.
Delinquencies
The Company believes delinquencies to be an indicator of loan portfolio credit quality at a point in time. The entire balance
of an account is contractually delinquent if the minimum payment is not received by the payment due date. Delinquencies not
only have the potential to impact earnings if the account charges off, but they also result in additional costs in terms of the
personnel and other resources dedicated to resolving the delinquencies.
37