Capital One 2005 Annual Report Download - page 49
Download and view the complete annual report
Please find page 49 of the 2005 Capital One annual report below. You can navigate through the pages in the report by either clicking on the pages listed below, or by using the keyword search tool below to find specific information within the annual report.-
 1
1 -
2
-
3
-
4
-
5
-
6
-
7
-
8
-
9
-
10
-
11
-
12
-
13
-
14
-
15
-
16
-
17
-
18
-
19
-
20
-
21
-
22
-
23
-
24
-
25
-
26
-
27
-
28
-
29
-
30
-
31
-
32
-
33
-
34
-
35
-
36
-
37
-
38
-
 39
39 -
 40
40 -
 41
41 -
 42
42 -
 43
43 -
 44
44 -
 45
45 -
 46
46 -
 47
47 -
 48
48 -
 49
49 -
 50
50 -
 51
51 -
 52
52 -
 53
53 -
 54
54 -
 55
55 -
 56
56 -
 57
57 -
 58
58 -
 59
59 -
60
-
61
-
62
-
63
-
64
-
65
-
66
-
67
-
68
-
69
-
70
-
71
-
72
-
73
-
74
-
75
-
76
-
77
-
78
-
79
-
80
-
81
-
82
-
83
-
84
-
85
-
86
-
87
-
88
-
89
-
90
-
91
-
92
-
93
-
94
-
95
-
96
-
97
-
98
-
99
-
100
-
101
-
102
-
103
-
104
-
105
-
106
-
107
-
108
-
109
-
110
-
111
-
112
-
113
-
114
-
115
-
116
-
117
-
118
-
119
-
120
-
121
-
122
-
123
-
124
-
125
-
126
-
127
-
128
-
129
 |
 |

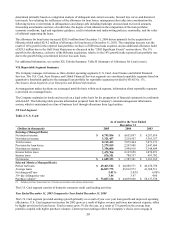
certain repricing practices prevalent in the industry that focus on short-term growth at the expense of customer loyalty and
enerating long-term profitability. g
The provision for loan losses increased 3% for the year ended December 31, 2005. The increase is due to an increase in 2005
bankruptcy related charge-offs resulting from the enactment of new bankruptcy legislation, $10.0 million in estimated future
l sses resulting from the Gulf Coast Hurricanes and growth in the loan portfolio. o
Non-interest expense for 2005 included a $16.8 million expense allocation related to the prepayment penalty for the
refinancing of the McLean Headquarters facility and an $85.3 million reduction in charges associated with the Company’ s
continued cost reduction initiatives compared to 2004. Exclusive of these charges, non-interest expense decreased 2%,
reflecting improved operating efficiencies.
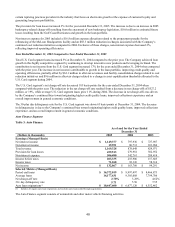
ear Ended December 31, 2004 Compared to Year Ended December 31, 2003 Y
Total U.S. Card segment loans increased 5% at December 31, 2004 compared to the prior year. The Company achieved loan
growth in this highly competitive segment by continuing to develop innovative new products and leveraging its brand. The
contribution to net income from the U.S. Card segment increased 17% for the year ended December 31, 2004 when compared
with the prior year. The increase in net income is attributable to growth in the loan portfolio, improving credit quality and
operating efficiencies, partially offset by $62.1 million in after-tax severance and facility consolidation charges related to cost
reduction initiatives and $9.6 million in after-tax charges related to a change in asset capitalization thresholds allocated to the
U.S. Card segment during 2004.
The U.S. Card segment’ s net charge-off rate decreased 183 basis points for the year ended December 31, 2004 when
compared with the prior year. The reduction in the net charge-off rate resulted from a decrease in net charge-offs of $527.2
million, or 19%, while average U.S. Card segment loans grew 11% during 2004. The decrease in net charge-offs was driven
by the Company’ s continued bias toward originating higher credit quality loans, improved collections experience and an
verall improvement in general economic conditions. o
The 30-plus day delinquency rate for the U.S. Card segment was down 63 basis points at December 31, 2004. The decrease
in delinquencies is due to the Company’ s continued bias toward originating higher credit quality loans, improved collections
xperience, and an overall improvement in general economic conditions. e
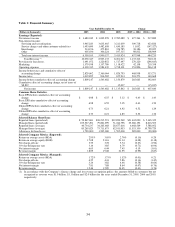
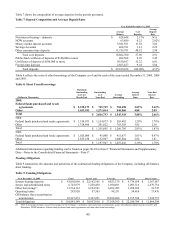
Auto Finance Segment
Table 3: Auto Finance
As of and for the Year Ended
December 31
(Dollars in thousands) 2005 2004 2003
Earnings (Managed Basis)
Net interest income $ 1,149,377 $ 797,936 $ 727,987
Non-interest income 19,951 80,712 101,984
Total revenue 1,169,328 878,648 829,971
Provision for loan losses 459,513 279,981 382,952
Non-interest expense 506,480 342,761 289,414
Income before taxes 203,335 255,906 157,605
Income taxes 71,268 92,126 58,314
Net income $ 132,067 $ 163,780 $ 99,291
Selected Metrics (Managed Basis)
Period end loans $ 16,372,019 $ 9,997,497 $ 8,466,873
Average loans 14,177,631 9,305,008 7,799,706
Net charge-off rate 2.70% 3.28% 4.62%
30+ day delinquency rate 5.71 5.50 7.55
Auto loan originations(1) $ 10,447,600 $ 6,677,120 $ 6,552,462
) Includes all organic auto loan originations and excludes auto loans added through acquisitions. (1
The Auto Finance segment consists of automobile and other motor vehicle financing activities.
40