Capital One 2005 Annual Report Download - page 66
Download and view the complete annual report
Please find page 66 of the 2005 Capital One annual report below. You can navigate through the pages in the report by either clicking on the pages listed below, or by using the keyword search tool below to find specific information within the annual report.-
 1
1 -
2
-
3
-
4
-
5
-
6
-
7
-
8
-
9
-
10
-
11
-
12
-
13
-
14
-
15
-
16
-
17
-
18
-
19
-
20
-
21
-
22
-
23
-
24
-
25
-
26
-
27
-
28
-
29
-
30
-
31
-
32
-
33
-
34
-
35
-
36
-
37
-
38
-
39
-
40
-
41
-
42
-
43
-
44
-
45
-
46
-
47
-
48
-
49
-
50
-
51
-
52
-
53
-
54
-
55
-
 56
56 -
 57
57 -
 58
58 -
 59
59 -
 60
60 -
 61
61 -
 62
62 -
 63
63 -
 64
64 -
 65
65 -
 66
66 -
 67
67 -
 68
68 -
 69
69 -
 70
70 -
 71
71 -
 72
72 -
 73
73 -
 74
74 -
 75
75 -
 76
76 -
77
-
78
-
79
-
80
-
81
-
82
-
83
-
84
-
85
-
86
-
87
-
88
-
89
-
90
-
91
-
92
-
93
-
94
-
95
-
96
-
97
-
98
-
99
-
100
-
101
-
102
-
103
-
104
-
105
-
106
-
107
-
108
-
109
-
110
-
111
-
112
-
113
-
114
-
115
-
116
-
117
-
118
-
119
-
120
-
121
-
122
-
123
-
124
-
125
-
126
-
127
-
128
-
129
 |
 |

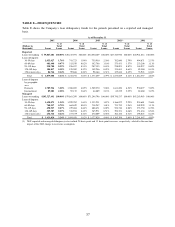
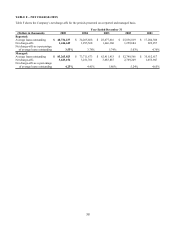
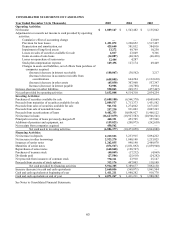
TABLE E—DELINQUENCIES
Table E shows the Company’s loan delinquency trends for the periods presented on a reported and managed
basis.
As of December 31
2005 2004 2003 2002(1) 2001
(Dollars in
thousands) Loans
%of
Total
Loans Loans
%of
Total
Loans Loans
%of
Total
Loans Loans
%of
Total
Loans Loans
%of
Total
Loans
Reported:
Loans outstanding $ 59,847,681 100.00% $38,215,591 100.00% $32,850,269 100.00% $27,343,930 100.00% $20,921,014 100.00%
Loans delinquent:
30-59 days 1,055,027 1.76% 741,723 1.94% 755,930 2.30% 762,040 2.79% 494,871 2.37%
60-89 days 401,640 0.67% 313,559 0.82% 362,766 1.10% 373,451 1.37% 233,206 1.11%
90-119 days 230,780 0.39% 196,457 0.51% 207,353 0.63% 238,091 0.87% 144,957 0.69%
120-149 days 104,817 0.18% 120,589 0.32% 149,246 0.45% 174,651 0.64% 85,580 0.41%
150 or more days 86,744 0.14% 99,866 0.26% 98,164 0.31% 125,636 0.45% 53,943 0.26%
Total $ 1,879,008 3.14% $ 1,472,194 3.85% $ 1,573,459 4.79% $ 1,673,869 6.12% $ 1,012,557 4.84%
Loans delinquent
by geographic
area:
Domestic 1,789,926 3.20% 1,380,022 4.05% 1,509,370 5.06% 1,611,650 6.56% 930,077 5.02%
International 89,082 2.28% 92,172 2.04% 64,089 2.13% 62,219 2.25% 82,480 3.47%
Managed:
Loans outstanding $105,527,491 100.00% $79,861,299 100.00% $71,244,796 100.00% $59,746,537 100.00% $45,263,963 100.00%
Loans delinquent:
30-59 days 1,620,075 1.54% 1,299,782 1.63% 1,335,231 1.87% 1,366,072 2.29% 934,681 2.06%
60-89 days 740,917 0.70% 664,629 0.83% 718,247 1.01% 753,735 1.26% 502,959 1.11%
90-119 days 498,927 0.47% 479,404 0.60% 488,471 0.69% 526,710 0.88% 353,750 0.78%
120-149 days 309,587 0.29% 336,924 0.42% 365,971 0.51% 394,721 0.66% 251,434 0.56%
150 or more days 254,314 0.24% 273,339 0.34% 270,009 0.38% 304,156 0.51% 198,823 0.44%
Total $ 3,423,820 3.24% $ 3,054,078 3.82% $ 3,177,929 4.46% $ 3,345,394 5.60% $ 2,241,647 4.95%
(1) 2002 reported and managed delinquency rates include 28 basis point and 13 basis point increases, respectively, related to the one-time
impact of the 2002 change in recoveries assumption.
57