Capital One 2005 Annual Report Download - page 51
Download and view the complete annual report
Please find page 51 of the 2005 Capital One annual report below. You can navigate through the pages in the report by either clicking on the pages listed below, or by using the keyword search tool below to find specific information within the annual report.-
 1
1 -
2
-
3
-
4
-
5
-
6
-
7
-
8
-
9
-
10
-
11
-
12
-
13
-
14
-
15
-
16
-
17
-
18
-
19
-
20
-
21
-
22
-
23
-
24
-
25
-
26
-
27
-
28
-
29
-
30
-
31
-
32
-
33
-
34
-
35
-
36
-
37
-
38
-
39
-
40
-
 41
41 -
 42
42 -
 43
43 -
 44
44 -
 45
45 -
 46
46 -
 47
47 -
 48
48 -
 49
49 -
 50
50 -
 51
51 -
 52
52 -
 53
53 -
 54
54 -
 55
55 -
 56
56 -
 57
57 -
 58
58 -
 59
59 -
 60
60 -
 61
61 -
62
-
63
-
64
-
65
-
66
-
67
-
68
-
69
-
70
-
71
-
72
-
73
-
74
-
75
-
76
-
77
-
78
-
79
-
80
-
81
-
82
-
83
-
84
-
85
-
86
-
87
-
88
-
89
-
90
-
91
-
92
-
93
-
94
-
95
-
96
-
97
-
98
-
99
-
100
-
101
-
102
-
103
-
104
-
105
-
106
-
107
-
108
-
109
-
110
-
111
-
112
-
113
-
114
-
115
-
116
-
117
-
118
-
119
-
120
-
121
-
122
-
123
-
124
-
125
-
126
-
127
-
128
-
129
 |
 |

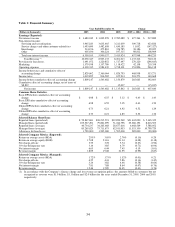
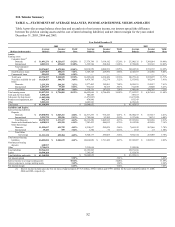
Global Financial Services Segment
Table 4: Global Financial Services
As of and for the Year Ended
December 31
(Dollars in thousands) 2005 2004 2003
Earnings (Managed Basis)
Net interest income $ 1,680,522 $ 1,421,508 $ 1,072,098
Non-interest income 1,022,756 844,192 605,821
Total revenue 2,703,278 2,265,700 1,677,919
Provision for loan losses 925,777 683,612 595,543
Non-interest expense 1,496,678 1,265,549 988,321
Income before taxes 280,823 316,539 94,055
Income taxes 94,796 103,459 29,216
Net income $ 186,027 $ 213,080 $ 64,839
Selected Metrics (Managed Basis)
Period end loans $ 23,386,490 $ 21,240,325 $ 16,507,937
Average loans 22,212,680 18,639,180 13,904,693
Net charge-off rate 3.97% 3.39% 3.83%
30+ day delinquency rate 2.83 2.81 2.70
The Global Financial Services segment consists of international lending activities, small business lending, installment loans,
ome loans, healthcare financing and other consumer financial service activities. h
ear Ended December 31, 2005 Compared to Year Ended December 31, 2004 Y
Global Financial Services segment’ s loan portfolio increased 10% year over year as a result of the underlying performance of
our North American businesses.
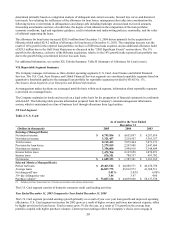
Global Financial Services net income decreased 13% for the year ended December 31, 2005 as a result of increases in
provision for loan losses and non-interest expense and one-time gains on the sales of the Company’ s joint venture investment
in South Africa and French loan portfolio that occurred during 2004, offset by increases in revenue. Total revenue increased
19% for the year ended December 31, 2005 as a result of a 19% growth in average loans for the same period and
contributions from the Global Financial Services businesses acquired in 2005.
The provision for loan losses increased 35% for the year ended December 31, 2005, as a result of growth in the loan portfolio
combined with deteriorating credit quality metrics in the U.K. during 2005.
Non-interest expense in 2005 included a $28.2 million impairment charge related to the write-off of goodwill and other
charges related to the Company’ s insurance brokerage business. Non-interest expense in 2004 included expense associated
with a change in fixed asset capitalization thresholds and impairment of internally developed software. Exclusive of these one
time charges and a $20.5 million reduction in employee termination and facility consolidation charges, non-interest expense
for the year ended December 31, 2005, increased 18% in line with the 19% growth in average managed loans.
Year Ended December 31, 2004 Compared to Year Ended December 31, 2003
Total Global Financial Services segment loans increased 29% at December 31, 2004, compared to the prior year. The
increase in total loans reflects the Company’ s continued successful efforts to diversify its loan portfolio, an increase in
account growth and the impact of changes in foreign currency exchange rates. Net income contribution from the Global
Financial Services segment for the year ended December 31, 2004, increased $148.2 million, compared to the prior year.
Global Financial Services segment net income includes after-tax charges of $17.0 million related to severance and facility
consolidation resulting from cost reduction initiatives, $2.4 million related to changes in asset capitalization thresholds, and
$10.3 million from the impairment of internally developed software. The overall improvement in the Global Financial
Services segment’ s financial performance was primarily due to the success of many of the Company’ s larger diversification
businesses in the U.S. and U.K.
During 2004, the Company sold its interest in a South African joint venture with a book value of $3.9 million to its joint
venture partner. The Company received $26.2 million in cash, was forgiven $9.2 million in liabilities and recognized a pre-
tax gain of $31.5 million. Also during 2004, the Company sold its French loan portfolio with a book value of $144.8 million
to an external party. The Company received $178.7 million in cash, recorded $7.2 million in notes receivable and recognized
42