Capital One 2005 Annual Report Download - page 73
Download and view the complete annual report
Please find page 73 of the 2005 Capital One annual report below. You can navigate through the pages in the report by either clicking on the pages listed below, or by using the keyword search tool below to find specific information within the annual report.-
 1
1 -
2
-
3
-
4
-
5
-
6
-
7
-
8
-
9
-
10
-
11
-
12
-
13
-
14
-
15
-
16
-
17
-
18
-
19
-
20
-
21
-
22
-
23
-
24
-
25
-
26
-
27
-
28
-
29
-
30
-
31
-
32
-
33
-
34
-
35
-
36
-
37
-
38
-
39
-
40
-
41
-
42
-
43
-
44
-
45
-
46
-
47
-
48
-
49
-
50
-
51
-
52
-
53
-
54
-
55
-
56
-
57
-
58
-
59
-
60
-
61
-
62
-
 63
63 -
 64
64 -
 65
65 -
 66
66 -
 67
67 -
 68
68 -
 69
69 -
 70
70 -
 71
71 -
 72
72 -
 73
73 -
 74
74 -
 75
75 -
 76
76 -
 77
77 -
 78
78 -
 79
79 -
 80
80 -
 81
81 -
 82
82 -
 83
83 -
84
-
85
-
86
-
87
-
88
-
89
-
90
-
91
-
92
-
93
-
94
-
95
-
96
-
97
-
98
-
99
-
100
-
101
-
102
-
103
-
104
-
105
-
106
-
107
-
108
-
109
-
110
-
111
-
112
-
113
-
114
-
115
-
116
-
117
-
118
-
119
-
120
-
121
-
122
-
123
-
124
-
125
-
126
-
127
-
128
-
129
 |
 |

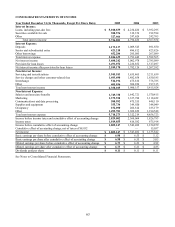
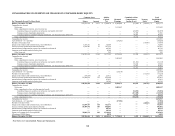
CONSOLIDATED STATEMENTS OF CHANGES IN STOCKHOLDERS’ EQUITY
Common Stock
(In Thousands, Except Per Share Data) Shares Amount
Paid-In
Capital,
Net Retained
Earnings
Cumulative Other
Comprehensive
Income (Loss) Treasury
Stock
Total
Stockholders’
Equity
Balance, December 31, 2002 227,073,162 $ 2,271 $ 1,704,470 $ 2,966,948 $ (15,566) $ (34,952) $ 4,623,171
Comprehensive income:
Net income — — — 1,135,842 — — 1,135,842
Other comprehensive income, net of income tax:
Unrealized losses on securities, net of income tax benefit of $12,247 — — — — (20,853) — (20,853)
Foreign currency translation adjustments — — — — 71,290 — 71,290
Unrealized gains on cash flow hedging instruments, net of income taxes of $28,359 — — — — 48,287 — 48,287
Other comprehensive income — — — — 98,724 — 98,724
Comprehensive income 1,234,566
Cash dividends—$.11 per share — — — (24,282) — — (24,282)
Purchases of treasury stock (14,569) (14,569)
Issuances of common and restricted stock, net of forfeitures 3,755,271 38 35,609 — — — 35,647
Exercise of stock options and related tax benefits 5,524,481 55 147,532 — — — 147,587
Amortization of compensation expense for restricted stock awards — — 40,743 — — — 40,743
Common stock issuable under incentive plan — — 8,706 — — — 8,706
Other items, net — — 242 — — — 242
Balance, December 31, 2003 236,352,914 2,364 1,937,302 4,078,508 83,158 (49,521) 6,051,811
Comprehensive income:
Net income — — — 1,543,482 — — 1,543,482
Other comprehensive income, net of income tax:
Unrealized losses on securities, net of income tax benefit of $29,048 — — — — (51,112) — (51,112)
Foreign currency translation adjustments — — — — 65,242 — 65,242
Unrealized gains on cash flow hedging instruments, net of income taxes of $26,516 — — — — 47,471 — 47,471
Other comprehensive income — — — — 61,601 — 61,601
Comprehensive income 1,605,083
Cash dividends—$.11 per share — — — (25,618) — — (25,618)
Purchase of treasury stock — — — — — (17,232) (17,232)
Issuances of common and restricted stock, net of forfeitures (59,534) (1) 23,911 — — — 23,910
Exercise of stock options and related tax benefits 12,060,879 121 622,940 — — — 623,061
Amortization of compensation expense for restricted stock awards — — 87,431 — — — 87,431
Common stock issuable under incentive plan — — 39,743 — — — 39,743
Balance, December 31, 2004 248,354,259 2,484 2,711,327 5,596,372 144,759 (66,753) 8,388,189
Comprehensive income:
Net income — — — 1,809,147 — — 1,809,147
Other comprehensive loss, net of income tax benefit:
Unrealized losses on securities, net of income tax benefit of $31,706 — — — — (54,876) — (54,876)
Foreign currency translation adjustments — — — — (113,189) — (113,189)
Unrealized gains on cash flow hedging instruments, net of income taxes of $21,373 — — — — 29,435 — 29,435
Other comprehensive loss — — — — (138,630) — (138,630)
Comprehensive income 1,670,517
Cash dividends—$.11 per share — — — (27,504) — — (27,504)
Purchase of treasury stock — — — — — (40,049) (40,049)
Issuances of common and restricted stock, net of forfeitures 11,059,437 110 761,371 — — — 761,481
Exercise of stock options and related tax benefits 10,489,976 105 506,897 — — — 507,002
Amortization of compensation expense for restricted stock awards — — 89,761 — — — 89,761
Common stock issuable under incentive plan — — 59,735 — — — 59,735
Issuance of common stock for acquisition 32,882,772 329 2,710,623 — — — 2,710,952
Allocation of ESOP shares
8,830
8,830
Balance, December 31, 2005 302,786,444 $ 3,028 $ 6,848,544 $ 7,378,015 $ 6,129 $ (106,802) $ 14,128,914
See Notes to Consolidated Financial Statements.
64