Capital One 2005 Annual Report Download - page 105
Download and view the complete annual report
Please find page 105 of the 2005 Capital One annual report below. You can navigate through the pages in the report by either clicking on the pages listed below, or by using the keyword search tool below to find specific information within the annual report.-
 1
1 -
2
-
3
-
4
-
5
-
6
-
7
-
8
-
9
-
10
-
11
-
12
-
13
-
14
-
15
-
16
-
17
-
18
-
19
-
20
-
21
-
22
-
23
-
24
-
25
-
26
-
27
-
28
-
29
-
30
-
31
-
32
-
33
-
34
-
35
-
36
-
37
-
38
-
39
-
40
-
41
-
42
-
43
-
44
-
45
-
46
-
47
-
48
-
49
-
50
-
51
-
52
-
53
-
54
-
55
-
56
-
57
-
58
-
59
-
60
-
61
-
62
-
63
-
64
-
65
-
66
-
67
-
68
-
69
-
70
-
71
-
72
-
73
-
74
-
75
-
76
-
77
-
78
-
79
-
80
-
81
-
82
-
83
-
84
-
85
-
86
-
87
-
88
-
89
-
90
-
91
-
92
-
93
-
94
-
 95
95 -
 96
96 -
 97
97 -
 98
98 -
 99
99 -
 100
100 -
 101
101 -
 102
102 -
 103
103 -
 104
104 -
 105
105 -
 106
106 -
 107
107 -
 108
108 -
 109
109 -
 110
110 -
 111
111 -
 112
112 -
 113
113 -
 114
114 -
 115
115 -
116
-
117
-
118
-
119
-
120
-
121
-
122
-
123
-
124
-
125
-
126
-
127
-
128
-
129
 |
 |

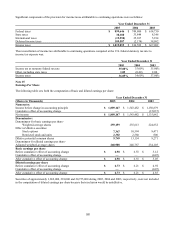
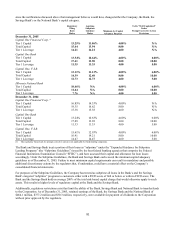
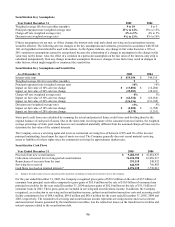
Securitization Key Assumptions
Year Ended December 31 2005 2004
Weighted average life for receivables (months) 9 to 10 8 to 9
Principal repayment rate (weighted average rate) 13% to 14% 13% to 15%
Charge-off rate (weighted average rate) 4% to 5% 4% to 5%
Discount rate (weighted average rate) 9% to 13% 8% to 10%
If these assumptions are not met, or if they change, the interest-only strip and related servicing and securitizations income
would be affected. The following adverse changes to the key assumptions and estimates, presented in accordance with SFAS
140, are hypothetical and should be used with caution. As the figures indicate, any change in fair value based on a 10% or
20% variation in assumptions cannot be extrapolated because the relationship of a change in assumption to the change in fair
value may not be linear. Also, the effect of a variation in a particular assumption on the fair value of the interest-only strip is
calculated independently from any change in another assumption. However, changes in one factor may result in changes in
other factors, which might magnify or counteract the sensitivities.
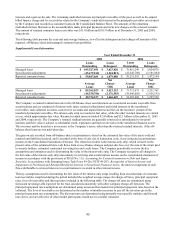
Securitization Key Assumptions and Sensitivities
As of December 31 2005 2004
Interest-only strip $ 419,196 $ 344,119
Weighted average life for receivables (months) 9 9
Principal repayment rate (weighted average rate) 14% 14%
Impact on fair value of 10% adverse change $ (13,802) $ (16,280)
Impact on fair value of 20% adverse change (25,203) (28,621)
Charge-off rate (weighted average rate) 4% 5%
Impact on fair value of 10% adverse change $ (62,326) $ (66,014)
Impact on fair value of 20% adverse change (124,536) (131,938)
Discount rate (weighted average rate) 13% 9%
Impact on fair value of 10% adverse change $ (2,202) $ (1,788)
Impact on fair value of 20% adverse change (4,378) (3,551)
Static pool credit losses are calculated by summing the actual and projected future credit losses and dividing them by the
original balance of each pool of assets. Due to the short-term revolving nature of the consumer loan receivables, the weighted
average percentage of static pool credit losses is not considered materially different from the assumed charge-off rates used to
determine the fair value of the retained interests.
The Company acts as a servicing agent and receives contractual servicing fees of between 0.50% and 6% of the investor
principal outstanding, based upon the type of assets serviced. The Company generally does not record material servicing
ssets or liabilities for these rights since the contractual servicing fee approximates market rates. a
S
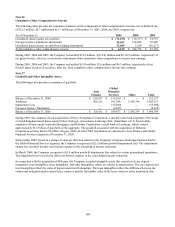
ecuritization Cash Flows
Year Ended December 31 2005 2004
Proceeds from new securitizations $ 9,482,333 $ 10,854,927
Collections reinvested in revolving-period securitizations 76,224,390 63,050,917
Repurchases of accounts from the trust 391,118 240,932
Servicing fees received 846,535 766,883
Cash flows received on retained interests(1) 4,076,128 3,730,012
(1
) Includes all cash receipts of excess spread and other payments (excluding servicing fees) from the Trust to the Company.
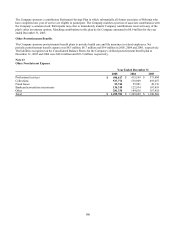
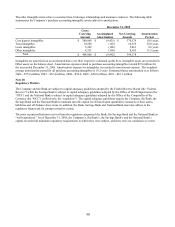
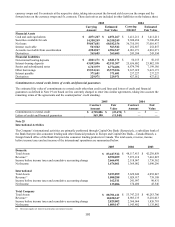
For the year ended December 31, 2005, the Company recognized gross gains of $58.2 million on the sale of $9.5 billion of
consumer loan principal receivables compared to gross gains of $55.8 million on the sale of $10.9 billion of consumer loan
principal receivables for the year ended December 31, 2004 and gross gains of $62.0 million on the sale of $11.5 billion of
consumer loans in 2003. These gross gains are included in servicing and securitizations income. In addition, the Company
recognized, as a reduction to servicing and securitizations income, upfront securitization transaction costs and recurring credit
facility commitment fees of $48.6 million, $69.0 million and $88.6 million for the years ended December 31, 2005, 2004 and
2003, respectively. The remainder of servicing and securitizations income represents servicing income and excess interest
and non-interest income generated by the transferred receivables, less the related net losses on the transferred receivables and
interest expense related to the securitization debt.
96