Capital One 2005 Annual Report Download - page 7
Download and view the complete annual report
Please find page 7 of the 2005 Capital One annual report below. You can navigate through the pages in the report by either clicking on the pages listed below, or by using the keyword search tool below to find specific information within the annual report.-
 1
1 -
 2
2 -
 3
3 -
 4
4 -
 5
5 -
 6
6 -
 7
7 -
 8
8 -
 9
9 -
 10
10 -
 11
11 -
 12
12 -
 13
13 -
 14
14 -
 15
15 -
 16
16 -
 17
17 -
 18
18 -
19
-
20
-
21
-
22
-
23
-
24
-
25
-
26
-
27
-
28
-
29
-
30
-
31
-
32
-
33
-
34
-
35
-
36
-
37
-
38
-
39
-
40
-
41
-
42
-
43
-
44
-
45
-
46
-
47
-
48
-
49
-
50
-
51
-
52
-
53
-
54
-
55
-
56
-
57
-
58
-
59
-
60
-
61
-
62
-
63
-
64
-
65
-
66
-
67
-
68
-
69
-
70
-
71
-
72
-
73
-
74
-
75
-
76
-
77
-
78
-
79
-
80
-
81
-
82
-
83
-
84
-
85
-
86
-
87
-
88
-
89
-
90
-
91
-
92
-
93
-
94
-
95
-
96
-
97
-
98
-
99
-
100
-
101
-
102
-
103
-
104
-
105
-
106
-
107
-
108
-
109
-
110
-
111
-
112
-
113
-
114
-
115
-
116
-
117
-
118
-
119
-
120
-
121
-
122
-
123
-
124
-
125
-
126
-
127
-
128
-
129
 |
 |

- 6 -
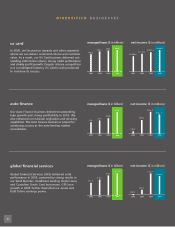
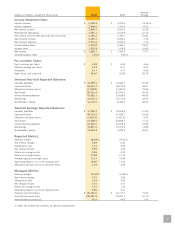
DIVERSIFIED BUSINESSES
us card
In 2005, we focused on rewards and other segments
where we can deliver consistent returns and customer
value. As a result, our US Card business delivered out-
standing bottom-line returns, strong credit performance
and steady profit growth. Despite intense competition
in a consolidated industry, US Card is well positioned
to continue its success.
auto finance
Our Auto Finance business delivered outstanding
loan growth and strong profitability in 2005. We
also enhanced our national origination and servicing
capabilities. The Auto Finance business is poised for
continuing success as the auto lending market
consolidates.
global financial services
Global Financial Services (GFS) delivered solid
performance in 2005, powered by strong results in
our Small Business, Installment Lending, Home Loans,
and Canadian Credit Card businesses. GFS loan
growth in 2005 further diversified our assets and
built future earnings power.
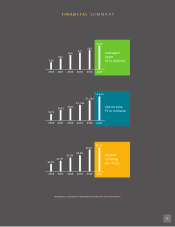
managed loans ($ in billions) net income ($ in millions)
managed loans ($ in billions) net income ($ in millions)
managed loans ($ in billions) net income ($ in millions)
2002
$40.9
2003
$46.3
2004
$48.6
2005
$49.5
2002
$1,000.8
2003
$1,181.2
2004
$1,387.3
2005
$1,609.4
2002
$7.0
2003
$8.5
2004
$10.0
2005
$16.4
2002
$10.3
2003
$99.3
2004
$163.8
2005
$132.1
2002
$11.9
2003
$16.5
2004
$21.2
2005
$23.4
2002
($8.1)
2003
$64.8
2004
$213.1
2005
$186.0