Capital One 2005 Annual Report Download - page 80
Download and view the complete annual report
Please find page 80 of the 2005 Capital One annual report below. You can navigate through the pages in the report by either clicking on the pages listed below, or by using the keyword search tool below to find specific information within the annual report.-
 1
1 -
2
-
3
-
4
-
5
-
6
-
7
-
8
-
9
-
10
-
11
-
12
-
13
-
14
-
15
-
16
-
17
-
18
-
19
-
20
-
21
-
22
-
23
-
24
-
25
-
26
-
27
-
28
-
29
-
30
-
31
-
32
-
33
-
34
-
35
-
36
-
37
-
38
-
39
-
40
-
41
-
42
-
43
-
44
-
45
-
46
-
47
-
48
-
49
-
50
-
51
-
52
-
53
-
54
-
55
-
56
-
57
-
58
-
59
-
60
-
61
-
62
-
63
-
64
-
65
-
66
-
67
-
68
-
69
-
 70
70 -
 71
71 -
 72
72 -
 73
73 -
 74
74 -
 75
75 -
 76
76 -
 77
77 -
 78
78 -
 79
79 -
 80
80 -
 81
81 -
 82
82 -
 83
83 -
 84
84 -
 85
85 -
 86
86 -
 87
87 -
 88
88 -
 89
89 -
 90
90 -
91
-
92
-
93
-
94
-
95
-
96
-
97
-
98
-
99
-
100
-
101
-
102
-
103
-
104
-
105
-
106
-
107
-
108
-
109
-
110
-
111
-
112
-
113
-
114
-
115
-
116
-
117
-
118
-
119
-
120
-
121
-
122
-
123
-
124
-
125
-
126
-
127
-
128
-
129
 |
 |

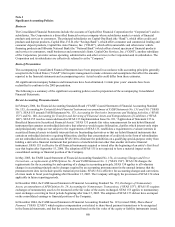
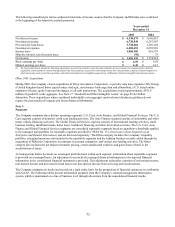
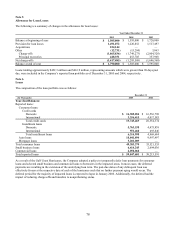
the fair value method had been applied to all awards since the original effective date of SFAS 123. The effect on net income
and earnings per share if the fair value based method had been applied to all outstanding and unvested awards in each period
is presented in the table below.
For the years ended December 31
Pro Forma Information 2005 2004 2003
Net income, as reported $ 1,809,147 $ 1,543,482 $ 1,135,842
Stock-based employee compensation expense included in reported net
income 87,578
77,800 31,842
Stock-based employee compensation expense determined under fair value
based method(1) (104,261) (192,904) (173,707)
Pro forma net income $ 1,792,464 $ 1,428,378 $ 993,977
Earnings per share:
Basic—as reported $ 6.98
$ 6.55 $ 5.05
Basic—pro forma $ 6.92
$ 6.06 $ 4.42
$ 6.21 Diluted—as reported $ 6.73 $ 4.85
Diluted—pro forma $ 6.61
$ 5.71 $ 4.33
(1
) Includes amortization of compensation expense for current year grants and prior year grants over the options’ vesting period.
Note 2
Business Combinations
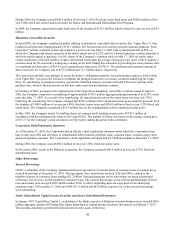
Hibernia Corporation
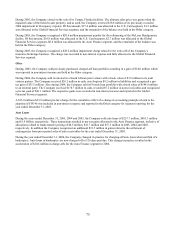
On November 16, 2005, the Company acquired 100% of the outstanding common stock of Hibernia Corporation
(“Hibernia”), a financial holding company with operations in Louisiana and Texas. Hibernia offers a variety of banking
roducts and services, including consumer, commercial and small business loans and demand and term deposit accounts. p
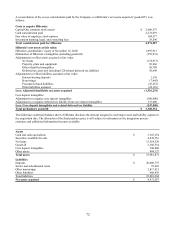
The acquisition was accounted for under the purchase method of accounting, and, as such, the assets and liabilities of
Hibernia were recorded at their respective fair values as of November 16, 2005. The results of Hibernia’ s operations were
cluded in the Company’ s Consolidated Statement of Income commencing November 16, 2005. in
The total consideration of $5.0 billion, which includes the value of outstanding stock options, was settled through the
issuance of 32.9 million shares of the Company’ s common stock and payment of $2.2 billion in cash. Under the terms of the
transaction, each share of Hibernia common stock was exchanged for $30.46 in cash or 0.3792 shares of the Company’ s
common stock or a combination of common stock and cash based on the aforementioned conversion rates, based on the
average of the closing prices on the NYSE of the Company’ s common stock during the five trading days ending the day
before the completion of the merger, which was $80.32.
71