BMW 2013 Annual Report Download - page 93
Download and view the complete annual report
Please find page 93 of the 2013 BMW annual report below. You can navigate through the pages in the report by either clicking on the pages listed below, or by using the keyword search tool below to find specific information within the annual report.-
 1
1 -
2
-
3
-
4
-
5
-
6
-
7
-
8
-
9
-
10
-
11
-
12
-
13
-
14
-
15
-
16
-
17
-
18
-
19
-
20
-
21
-
22
-
23
-
24
-
25
-
26
-
27
-
28
-
29
-
30
-
31
-
32
-
33
-
34
-
35
-
36
-
37
-
38
-
39
-
40
-
41
-
42
-
43
-
44
-
45
-
46
-
47
-
48
-
49
-
50
-
51
-
52
-
53
-
54
-
55
-
56
-
57
-
58
-
59
-
60
-
61
-
62
-
63
-
64
-
65
-
66
-
67
-
68
-
69
-
70
-
71
-
72
-
73
-
74
-
75
-
76
-
77
-
78
-
79
-
80
-
81
-
82
-
 83
83 -
 84
84 -
 85
85 -
 86
86 -
 87
87 -
 88
88 -
 89
89 -
 90
90 -
 91
91 -
 92
92 -
 93
93 -
 94
94 -
 95
95 -
 96
96 -
 97
97 -
 98
98 -
 99
99 -
 100
100 -
 101
101 -
 102
102 -
 103
103 -
104
-
105
-
106
-
107
-
108
-
109
-
110
-
111
-
112
-
113
-
114
-
115
-
116
-
117
-
118
-
119
-
120
-
121
-
122
-
123
-
124
-
125
-
126
-
127
-
128
-
129
-
130
-
131
-
132
-
133
-
134
-
135
-
136
-
137
-
138
-
139
-
140
-
141
-
142
-
143
-
144
-
145
-
146
-
147
-
148
-
149
-
150
-
151
-
152
-
153
-
154
-
155
-
156
-
157
-
158
-
159
-
160
-
161
-
162
-
163
-
164
-
165
-
166
-
167
-
168
-
169
-
170
-
171
-
172
-
173
-
174
-
175
-
176
-
177
-
178
-
179
-
180
-
181
-
182
-
183
-
184
-
185
-
186
-
187
-
188
-
189
-
190
-
191
-
192
-
193
-
194
-
195
-
196
-
197
-
198
-
199
-
200
-
201
-
202
-
203
-
204
-
205
-
206
-
207
-
208
 |
 |

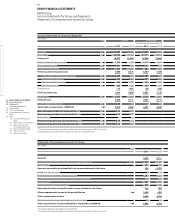
93 GROUP FINANCIAL STATEMENTS
Automotive Financial Services
(unaudited supplementary information) (unaudited supplementary information)
2013 2012
1, 2
2013 2012 2
4,408 4,717 1,112 1,016 Net profit
Reconciliation between net profit and cash inflow / outflow from operating activities
2,516 3,026 – 137 – 104 Current tax
153 104 – 3 3 –3 Other interest and similar income / expenses
3,745 3,679 20 38 Depreciation and amortisation of other tangible, intangible and investment assets
373 267 153 – 2 Change in provisions
109 23 – 2,895 – 2,256 Change in leased products
– – – 4,501 – 3,988 Change in receivables from sales financing
– 239 – 391 678 497 Change in deferred taxes
– 55 265 54 – 13 Other non-cash income and expense items
– 22 – 14 – – 2 Gain / loss on disposal of tangible and intangible assets and marketable securities
– 398 – 271 – – Result from equity accounted investments
1,015 1,622 24 18 Changes in working capital
– 226 – 54 4 – Change in inventories
53 722 – 25 19 Change in trade receivables
1,188 954 45 – 1 Change in trade payables
141 – 1,918 269 743 Change in other operating assets and liabilities
– 2,487 – 2,191 – 132 – 139 Income taxes paid
191 249 – 3 –3 Interest received
9,450 9,167 – 5,358 – 4,192 Cash inflow / outflow from operating activities
– 6,575 – 5,074 – 9 – 37 Investment in intangible assets and property, plant and equipment
15 35 7 7 Proceeds from the disposal of intangible assets and property, plant and equipment
– 528 – 384 – – Expenditure for investments
137 65 163 – Proceeds from the disposal of investments
– 3,445 – 1,167 – 179 – 97 Cash payments for the purchase of marketable securities
2,908 995 342 95 Cash proceeds from the sale of marketable securities
– 7,488 – 5,530 324 – 32 Cash inflow / outflow from investing activities
– – – – Issue / buy-back of treasury shares
17 19 – – Payments into equity
– 1,653 – 1,516 – – Payment of dividend for the previous year
– 582 – 833 3,844 1,505 Intragroup financing and equity transactions
– 149 – 157 – 3 –3 Interest paid
– – 1,099 1,189 Proceeds from the issue of bonds
– – – 1,383 – 842 Repayment of bonds
85 600 6,015 6,523 Proceeds from new non-current other financial liabilities
– 26 – 127 – 4,940 – 5,101 Repayment of non-current other financial liabilities
125 35 517 231 Change in current other financial liabilities
– 489 – 4 – – Change in commercial paper
– 2,672 – 1,983 5,152 3,505 Cash inflow / outflow from financing activities
– 53 – 11 – 36 – 3 Effect of exchange rate on cash and cash equivalents
47 12 – 1 Effect of changes in composition of Group on cash and cash equivalents
– 716 1,655 82 – 721 Change in cash and cash equivalents
7,484 5,829 797 1,518 Cash and cash equivalents as at 1 January
6,768 7,484 879 797 Cash and cash equivalents as at 31 December