BMW 2013 Annual Report Download - page 114
Download and view the complete annual report
Please find page 114 of the 2013 BMW annual report below. You can navigate through the pages in the report by either clicking on the pages listed below, or by using the keyword search tool below to find specific information within the annual report.-
 1
1 -
2
-
3
-
4
-
5
-
6
-
7
-
8
-
9
-
10
-
11
-
12
-
13
-
14
-
15
-
16
-
17
-
18
-
19
-
20
-
21
-
22
-
23
-
24
-
25
-
26
-
27
-
28
-
29
-
30
-
31
-
32
-
33
-
34
-
35
-
36
-
37
-
38
-
39
-
40
-
41
-
42
-
43
-
44
-
45
-
46
-
47
-
48
-
49
-
50
-
51
-
52
-
53
-
54
-
55
-
56
-
57
-
58
-
59
-
60
-
61
-
62
-
63
-
64
-
65
-
66
-
67
-
68
-
69
-
70
-
71
-
72
-
73
-
74
-
75
-
76
-
77
-
78
-
79
-
80
-
81
-
82
-
83
-
84
-
85
-
86
-
87
-
88
-
89
-
90
-
91
-
92
-
93
-
94
-
95
-
96
-
97
-
98
-
99
-
100
-
101
-
102
-
103
-
 104
104 -
 105
105 -
 106
106 -
 107
107 -
 108
108 -
 109
109 -
 110
110 -
 111
111 -
 112
112 -
 113
113 -
 114
114 -
 115
115 -
 116
116 -
 117
117 -
 118
118 -
 119
119 -
 120
120 -
 121
121 -
 122
122 -
 123
123 -
 124
124 -
125
-
126
-
127
-
128
-
129
-
130
-
131
-
132
-
133
-
134
-
135
-
136
-
137
-
138
-
139
-
140
-
141
-
142
-
143
-
144
-
145
-
146
-
147
-
148
-
149
-
150
-
151
-
152
-
153
-
154
-
155
-
156
-
157
-
158
-
159
-
160
-
161
-
162
-
163
-
164
-
165
-
166
-
167
-
168
-
169
-
170
-
171
-
172
-
173
-
174
-
175
-
176
-
177
-
178
-
179
-
180
-
181
-
182
-
183
-
184
-
185
-
186
-
187
-
188
-
189
-
190
-
191
-
192
-
193
-
194
-
195
-
196
-
197
-
198
-
199
-
200
-
201
-
202
-
203
-
204
-
205
-
206
-
207
-
208
 |
 |

114
88 GROUP FINANCIAL STATEMENTS
88 Income Statements
88 Statement of
Comprehensive Income
90 Balance Sheets
92 Cash Flow Statements
94 Group Statement of Changes in
Equity
96 Notes
96 Accounting Principles and
Policies
114 Notes to the Income Statement
121 Notes to the Statement
of Comprehensive Income
122
Notes to the Balance Sheet
145 Other Disclosures
161 Segment Information
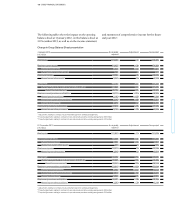
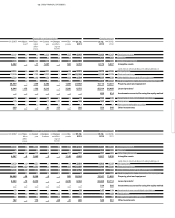
in € million 2 013 2012
Sales of products and related goods 56,811 58,039
Income from lease instalments 7,296 6,900
Sale of products previously leased to customers 6,412 6,399
Interest income on loan financing 2,868 2,954
Other income 2,671 2,556
Revenues 76,058 76,848
in € million 2 013 2012
Manufacturing costs 36,572 37,648
Research and development expenses 4,117 3,993
Warranty expenditure 1,243 1,200
Cost of sales directly attributable to financial services 14,044 13,370
Interest expense relating to financial services business 1,483 1,819
Expense for risk provisions and write-downs for financial services business 435 798
Other cost of sales 2,890 2,526
Cost of sales 60,784 61,354
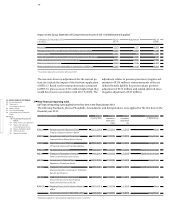
in € million 2 013 2012
Research and development expenses 4,117 3,993
Amortisation – 1,069 – 1,130
New expenditure for capitalised development costs 1,744 1,089
Total research and development expenditure 4,792 3,952
BMW Group
Notes to the Group Financial Statements
Notes to the Income Statement
9
10
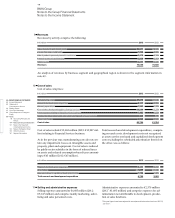
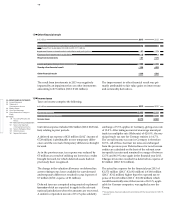
Revenues
Revenues by activity comprise the following:
An analysis of revenues by business segment and geographical region is shown in the segment information in
note
49.
11
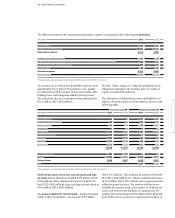
Cost of sales
Cost of sales comprises:
Cost of sales include € 15,962 million (2012: € 15,987 mil-
lion) relating to Financial Services business.
As in the previous year, manufacturing costs do not con-
tain
any impairment losses on intangible assets and
property, plant and equipment. Cost of sales is reduced
by public-sector subsidies in the form of reduced taxes
on assets and reduced consumption-based taxes
amount-
ing to € 45 million (2012: € 45 million).
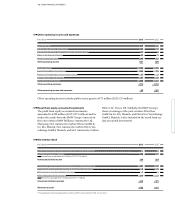
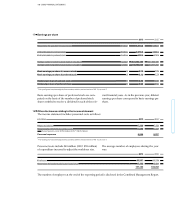
Selling and administrative expenses
Selling expenses amounted to € 4,885 million (2012:
€ 5,147 million) and comprise mainly marketing, adver-
tising and sales personnel costs.
Total research and development expenditure, compris-
ing research costs, development costs not recognised
as assets on the one hand and capitalised development
costs excluding the scheduled amortisation thereof on
the other, was as follows:
Administrative expenses amounted to € 2,370 million
(2012*: € 1,885 million) and comprise expenses for ad-
ministration not attributable to development, produc-
tion or sales functions.
* Prior year figures have been adjusted in accordance with the revised version of IAS 19,
see note 7.