BMW 2013 Annual Report Download - page 144
Download and view the complete annual report
Please find page 144 of the 2013 BMW annual report below. You can navigate through the pages in the report by either clicking on the pages listed below, or by using the keyword search tool below to find specific information within the annual report.-
 1
1 -
2
-
3
-
4
-
5
-
6
-
7
-
8
-
9
-
10
-
11
-
12
-
13
-
14
-
15
-
16
-
17
-
18
-
19
-
20
-
21
-
22
-
23
-
24
-
25
-
26
-
27
-
28
-
29
-
30
-
31
-
32
-
33
-
34
-
35
-
36
-
37
-
38
-
39
-
40
-
41
-
42
-
43
-
44
-
45
-
46
-
47
-
48
-
49
-
50
-
51
-
52
-
53
-
54
-
55
-
56
-
57
-
58
-
59
-
60
-
61
-
62
-
63
-
64
-
65
-
66
-
67
-
68
-
69
-
70
-
71
-
72
-
73
-
74
-
75
-
76
-
77
-
78
-
79
-
80
-
81
-
82
-
83
-
84
-
85
-
86
-
87
-
88
-
89
-
90
-
91
-
92
-
93
-
94
-
95
-
96
-
97
-
98
-
99
-
100
-
101
-
102
-
103
-
104
-
105
-
106
-
107
-
108
-
109
-
110
-
111
-
112
-
113
-
114
-
115
-
116
-
117
-
118
-
119
-
120
-
121
-
122
-
123
-
124
-
125
-
126
-
127
-
128
-
129
-
130
-
131
-
132
-
133
-
 134
134 -
 135
135 -
 136
136 -
 137
137 -
 138
138 -
 139
139 -
 140
140 -
 141
141 -
 142
142 -
 143
143 -
 144
144 -
 145
145 -
 146
146 -
 147
147 -
 148
148 -
 149
149 -
 150
150 -
 151
151 -
 152
152 -
 153
153 -
 154
154 -
155
-
156
-
157
-
158
-
159
-
160
-
161
-
162
-
163
-
164
-
165
-
166
-
167
-
168
-
169
-
170
-
171
-
172
-
173
-
174
-
175
-
176
-
177
-
178
-
179
-
180
-
181
-
182
-
183
-
184
-
185
-
186
-
187
-
188
-
189
-
190
-
191
-
192
-
193
-
194
-
195
-
196
-
197
-
198
-
199
-
200
-
201
-
202
-
203
-
204
-
205
-
206
-
207
-
208
 |
 |

144
88 GROUP FINANCIAL STATEMENTS
88 Income Statements
88 Statement of
Comprehensive Income
90 Balance Sheets
92 Cash Flow Statements
94 Group Statement of Changes in
Equity
96 Notes
96 Accounting Principles and
Policies
114 Notes to the Income Statement
121 Notes to the Statement
of Comprehensive Income
122
Notes to the Balance Sheet
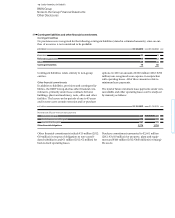
145 Other Disclosures
161 Segment Information
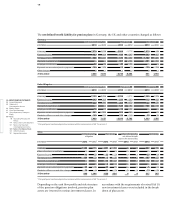
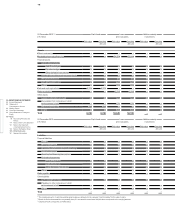
31 December 2012 Maturity Maturity Maturity Total
in € million within between one later than
one year and five years five years
Other taxes 697 1 15 713
Social security 46 23 7 76
Advance payments from customers 603 65 – 668
Deposits received 355 91 20 466
Payables to subsidiaries 236 – – 236
Payables to other companies in which an investment is held 1 – – 1
Deferred income 1,496 2,704 312 4,512
Other 3,358 157 9 3,524
Other liabilities 6,792 3,041 363 10,196
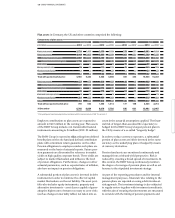
in € million 31. 12. 2013 31. 12. 2012
Total thereof Total thereof
due within due within
one year one year
Deferred income from lease financing 1,774 761 1,743 791
Deferred income relating to service contracts 2,855 837 2,478 615
Grants 193 20 196 28
Other deferred income 104 48 95 62
Deferred income 4,926 1,666 4,512 1,496
Deferred income comprises the following items:
Deferred income relating to service contracts relates to
service and repair work to be provided under commit-
ments given at the time of the sale of a vehicle (multi-
component arrangements). Grants comprise primarily
public sector funds to promote regional structures and
which have been invested in the production plants in
The total amount of financial liabilities, other liabilities and trade payables with a maturity later than five years
amounts to € 3,635 million (2012: € 6,702 million).
Leipzig and Berlin. The grants are subject to holding
periods for the assets concerned of up to five years and
minimum employment figures. All conditions attached
to the grants were complied with at 31 December 2013.
In accordance with IAS 20, grant income is recognised
over the useful lives of the assets to which they relate.
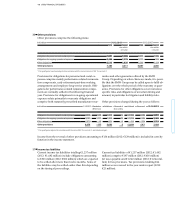
31 December 2013 Maturity Maturity Maturity Total
in € million within between one later than
one year and five years five years
Trade payables 7,283 192 – 7,475
31 December 2012 Maturity Maturity Maturity Total
in € million within between one later than
one year and five years five years
Trade payables 6,424 9 – 6,433
40
Trade payables