BMW 2013 Annual Report Download - page 47
Download and view the complete annual report
Please find page 47 of the 2013 BMW annual report below. You can navigate through the pages in the report by either clicking on the pages listed below, or by using the keyword search tool below to find specific information within the annual report.-
 1
1 -
2
-
3
-
4
-
5
-
6
-
7
-
8
-
9
-
10
-
11
-
12
-
13
-
14
-
15
-
16
-
17
-
18
-
19
-
20
-
21
-
22
-
23
-
24
-
25
-
26
-
27
-
28
-
29
-
30
-
31
-
32
-
33
-
34
-
35
-
36
-
 37
37 -
 38
38 -
 39
39 -
 40
40 -
 41
41 -
 42
42 -
 43
43 -
 44
44 -
 45
45 -
 46
46 -
 47
47 -
 48
48 -
 49
49 -
 50
50 -
 51
51 -
 52
52 -
 53
53 -
 54
54 -
 55
55 -
 56
56 -
 57
57 -
58
-
59
-
60
-
61
-
62
-
63
-
64
-
65
-
66
-
67
-
68
-
69
-
70
-
71
-
72
-
73
-
74
-
75
-
76
-
77
-
78
-
79
-
80
-
81
-
82
-
83
-
84
-
85
-
86
-
87
-
88
-
89
-
90
-
91
-
92
-
93
-
94
-
95
-
96
-
97
-
98
-
99
-
100
-
101
-
102
-
103
-
104
-
105
-
106
-
107
-
108
-
109
-
110
-
111
-
112
-
113
-
114
-
115
-
116
-
117
-
118
-
119
-
120
-
121
-
122
-
123
-
124
-
125
-
126
-
127
-
128
-
129
-
130
-
131
-
132
-
133
-
134
-
135
-
136
-
137
-
138
-
139
-
140
-
141
-
142
-
143
-
144
-
145
-
146
-
147
-
148
-
149
-
150
-
151
-
152
-
153
-
154
-
155
-
156
-
157
-
158
-
159
-
160
-
161
-
162
-
163
-
164
-
165
-
166
-
167
-
168
-
169
-
170
-
171
-
172
-
173
-
174
-
175
-
176
-
177
-
178
-
179
-
180
-
181
-
182
-
183
-
184
-
185
-
186
-
187
-
188
-
189
-
190
-
191
-
192
-
193
-
194
-
195
-
196
-
197
-
198
-
199
-
200
-
201
-
202
-
203
-
204
-
205
-
206
-
207
-
208
 |
 |

47 COMBINED MANAGEMENT REPORT
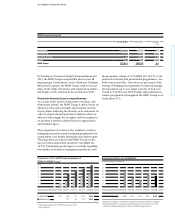
Group Income Statement
in € million
2013 2012
Revenues 76,058 76,848
Cost of sales – 60,784 – 61,354
Gross profit 15,274 15,494
Selling and administrative expenses – 7,255 – 7,032
Other operating income 841 829
Other operating expenses – 874 – 1,016
Profit before financial result 7,986 8,275
Result from equity accounted investments 398 271
Interest and similar income 184 224
Interest and similar expenses – 449 – 375
Other financial result – 206 – 592
Financial result – 73 – 472
Profit before tax 7,913 7,803
Income taxes – 2,573 – 2,692
Net profit 5,340 5,111
1 Prior year figures have been adjusted in accordance with the revised version of IAS 19, see note 7.
2 Includes cars manufactured by the BMW Brilliance joint venture.
Earnings performance1
The BMW Group is able to look back on another success-
ful
year. The number of BMW, MINI and Rolls-Royce
brand cars sold rose by 6.4 % to 1,963,798
2
units, enabling
the BMW Group to retain pole position at the head of
the premium segment in the automotive industry.
The BMW Group recorded a net profit of € 5,340 million
(2012: € 5,111 million) for the financial year 2013. The
post-tax return on sales was 7.0 % (2012: 6.7 %). Earnings
per share of common and preferred stock were € 8.10 and
€ 8.12 respectively (2012: € 7.75 and € 7.77 respectively).
Group revenues decreased by 1.0 % to € 76,058 million
(2012: € 76,848 million). Inter-segment revenue elimi-
nations
increased as a result of the steep rise in new
leasing business. The depreciation of some of the major
currencies in which the BMW Group does business –
such as the US dollar, the Japanese yen, the Australian
dollar and the South African rand – also caused reve-
nues to fall slightly, despite the fact that sales volumes
were higher than one year earlier. Adjusted for
ex-
change rate factors, the increase in revenues was 1.9 %.
Revenues comprise mainly the sale of cars and motor-
cycles (2013: € 56,811 million; 2012: € 58,039 million),
lease instalments (2013: € 7,296 million; 2012: € 6,900
million), the sale of products previously leased to cus-
tomers (2013: € 6,412 million; 2012: € 6,399 million) and
interest income on loan financing (2013: € 2,868 mil-
lion; 2012: € 2,954 million).
Revenues from the sale of BMW, MINI and Rolls-Royce
brand cars were slightly down on the previous year
(2.1 %). Adjusted for exchange rate factors, revenues in-
creased by 0.9 %. Motorcycles business revenues were
1.2 % up on the previous year. Revenues generated with
Financial Services operations grew by 2.3 %. Adjusted
for exchange rate factors, revenues of the Motorcycles
and Financial Services segments rose by 4.6 % and 4.7 %
respectively.
Group revenues were spread fairly evenly across all re-
gions, with the Europe region (including Germany)
accounting for 45.2 % (2012: 45.7 %), the Americas region
for 20.7 % (2012: 21.2 %) and the Africa, Asia and Oceania
region for 34.1 % (2012: 33.1 %) of business.
Report on Economic Position
Results of Operations, Financial Position and Net Assets