BMW 2013 Annual Report Download - page 117
Download and view the complete annual report
Please find page 117 of the 2013 BMW annual report below. You can navigate through the pages in the report by either clicking on the pages listed below, or by using the keyword search tool below to find specific information within the annual report.-
 1
1 -
2
-
3
-
4
-
5
-
6
-
7
-
8
-
9
-
10
-
11
-
12
-
13
-
14
-
15
-
16
-
17
-
18
-
19
-
20
-
21
-
22
-
23
-
24
-
25
-
26
-
27
-
28
-
29
-
30
-
31
-
32
-
33
-
34
-
35
-
36
-
37
-
38
-
39
-
40
-
41
-
42
-
43
-
44
-
45
-
46
-
47
-
48
-
49
-
50
-
51
-
52
-
53
-
54
-
55
-
56
-
57
-
58
-
59
-
60
-
61
-
62
-
63
-
64
-
65
-
66
-
67
-
68
-
69
-
70
-
71
-
72
-
73
-
74
-
75
-
76
-
77
-
78
-
79
-
80
-
81
-
82
-
83
-
84
-
85
-
86
-
87
-
88
-
89
-
90
-
91
-
92
-
93
-
94
-
95
-
96
-
97
-
98
-
99
-
100
-
101
-
102
-
103
-
104
-
105
-
106
-
 107
107 -
 108
108 -
 109
109 -
 110
110 -
 111
111 -
 112
112 -
 113
113 -
 114
114 -
 115
115 -
 116
116 -
 117
117 -
 118
118 -
 119
119 -
 120
120 -
 121
121 -
 122
122 -
 123
123 -
 124
124 -
 125
125 -
 126
126 -
 127
127 -
128
-
129
-
130
-
131
-
132
-
133
-
134
-
135
-
136
-
137
-
138
-
139
-
140
-
141
-
142
-
143
-
144
-
145
-
146
-
147
-
148
-
149
-
150
-
151
-
152
-
153
-
154
-
155
-
156
-
157
-
158
-
159
-
160
-
161
-
162
-
163
-
164
-
165
-
166
-
167
-
168
-
169
-
170
-
171
-
172
-
173
-
174
-
175
-
176
-
177
-
178
-
179
-
180
-
181
-
182
-
183
-
184
-
185
-
186
-
187
-
188
-
189
-
190
-
191
-
192
-
193
-
194
-
195
-
196
-
197
-
198
-
199
-
200
-
201
-
202
-
203
-
204
-
205
-
206
-
207
-
208
 |
 |

117 GROUP FINANCIAL STATEMENTS
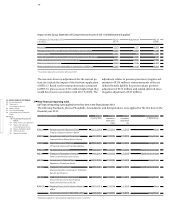
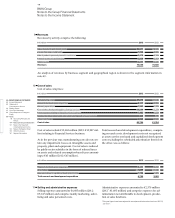
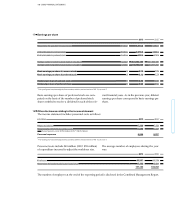
The difference between the expected and actual tax expense is explained in the following reconciliation:
Tax increases as a result of non-deductible expenses were
significantly lower than in the previous year, mainly
in connection with the impact of non-recoverable with-
holding taxes and intragroup transfer pricing issues.
Tax reductions due to tax-exempt income amounted to
€ 117 million (2012: € 89 million).
Deferred tax assets on tax loss carryforwards and capi-
tal losses before allowances totalled € 725 million (2012:
€ 923 million). After valuation allowances of € 409 mil-
lion (2012: € 492 million), their carrying amount stood at
€ 316 million (2012: € 431 million).
Tax losses available for carryforward – for the most part
usable without restriction – decreased to € 0.9 billion
The line “Other variances” comprises primarily recon-
ciling items relating to the Group’s share of results of
equity accounted investments.
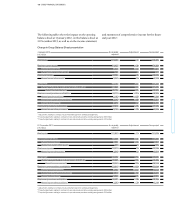
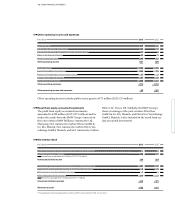
The allocation of deferred tax assets and liabilities to
balance sheet line items at 31 December is shown in the
following table:
(2012: € 1.3 billion). This includes an amount of € 42 mil-
lion (2012: € 92 million), for which a valuation allowance
of € 14 million (2012: € 27 million) was recognised on the
related deferred tax asset. For entities with tax losses
available for carryforward, a net surplus of deferred tax
assets over deferred tax liabilities is reported at 31 De-
cember 2013 amounting to € 192 million (2012: € 204 mil-
lion). Deferred tax assets are recognised on the basis of
Deferred tax assets Deferred tax liabilities
in € million 2013 2012* 2013 2012*
Intangible assets 9 5 1,571 1,356
Property, plant and equipment 26 37 264 260
Leased products 436 441 5,779 5,837
Investments 6 11 5 11
Other assets 1,078 1,067 3,747 3,503
Tax loss carryforwards 725 923 – –
Provisions 3,220 3,219 47 95
Liabilities 2,928 2,984 449 350
Eliminations 2,570 2,729 661 626
10,998 11,416 12,523 12,038
Valuation allowance – 409 – 492 – –
Netting – 8,969 – 8,957 – 8,969 – 8,957
Deferred taxes 1,620 1,967 3,554 3,081
Net 1,934 1,114
* Prior year figures have been adjusted in accordance with the revised version of IAS 19, see note 7.
in € million 2 013 2012*
Profit before tax 7,913 7,803
Tax rate applicable in Germany 30.5 % 30.5 %
Expected tax expense 2,413 2,380
Variances due to different tax rates – 131 – 56
Tax increases (+) / tax reductions (–) as a result of non-deductible expenses and tax-exempt income 164 302
Tax expense (+) / benefits (–) for prior years 222 128
Other variances – 95 – 62
Actual tax expense 2,573 2,692
Effective tax rate 32.5 % 34.5 %
* Prior year figures have been adjusted in accordance with the revised version of IAS 19, see note 7.