BMW 2013 Annual Report Download - page 45
Download and view the complete annual report
Please find page 45 of the 2013 BMW annual report below. You can navigate through the pages in the report by either clicking on the pages listed below, or by using the keyword search tool below to find specific information within the annual report.-
 1
1 -
2
-
3
-
4
-
5
-
6
-
7
-
8
-
9
-
10
-
11
-
12
-
13
-
14
-
15
-
16
-
17
-
18
-
19
-
20
-
21
-
22
-
23
-
24
-
25
-
26
-
27
-
28
-
29
-
30
-
31
-
32
-
33
-
34
-
 35
35 -
 36
36 -
 37
37 -
 38
38 -
 39
39 -
 40
40 -
 41
41 -
 42
42 -
 43
43 -
 44
44 -
 45
45 -
 46
46 -
 47
47 -
 48
48 -
 49
49 -
 50
50 -
 51
51 -
 52
52 -
 53
53 -
 54
54 -
 55
55 -
56
-
57
-
58
-
59
-
60
-
61
-
62
-
63
-
64
-
65
-
66
-
67
-
68
-
69
-
70
-
71
-
72
-
73
-
74
-
75
-
76
-
77
-
78
-
79
-
80
-
81
-
82
-
83
-
84
-
85
-
86
-
87
-
88
-
89
-
90
-
91
-
92
-
93
-
94
-
95
-
96
-
97
-
98
-
99
-
100
-
101
-
102
-
103
-
104
-
105
-
106
-
107
-
108
-
109
-
110
-
111
-
112
-
113
-
114
-
115
-
116
-
117
-
118
-
119
-
120
-
121
-
122
-
123
-
124
-
125
-
126
-
127
-
128
-
129
-
130
-
131
-
132
-
133
-
134
-
135
-
136
-
137
-
138
-
139
-
140
-
141
-
142
-
143
-
144
-
145
-
146
-
147
-
148
-
149
-
150
-
151
-
152
-
153
-
154
-
155
-
156
-
157
-
158
-
159
-
160
-
161
-
162
-
163
-
164
-
165
-
166
-
167
-
168
-
169
-
170
-
171
-
172
-
173
-
174
-
175
-
176
-
177
-
178
-
179
-
180
-
181
-
182
-
183
-
184
-
185
-
186
-
187
-
188
-
189
-
190
-
191
-
192
-
193
-
194
-
195
-
196
-
197
-
198
-
199
-
200
-
201
-
202
-
203
-
204
-
205
-
206
-
207
-
208
 |
 |

45 COMBINED MANAGEMENT REPORT
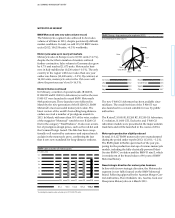
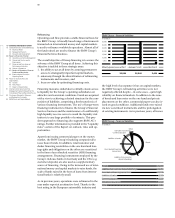
Energy consumed* per vehicle produced
in MWh / vehicle
3.00
2.80
2.60
2.40
2.20
2.00
09 10 11 12 13
2.84 2.72 2.43 2.41 2.36
* Excluding contract production, adjusted for CHP losses.
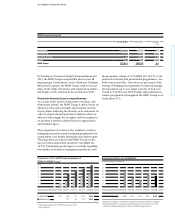
Water consumption* per vehicle produced
in m3 / vehicle
2.80
2.60
2.40
2.20
2.00
1.80
09 10 11 12 13
2.66 2.40 2.25 2.22 2.18
* Excluding contract production.
Sustainability in the value-added chain
Sustainability criteria also play a major role in the field
of transport logistics as well as in the selection and as-
sessment of our suppliers. Sustainability requirements
apply not only to our suppliers, but also to our transpor-
tation service providers. The amount of energy needed
for transportation purposes has considerably increased
in recent years. In order to keep carbon emissions to an
absolute minimum, we work on the principle “produc-
tion follows the market”. In addition, we are working on
improving our packaging and continually increasing
the percentage of low-carbon types of transportation. In
total, 60.7 % of all new cars left our plants by rail during
the twelve-month period under report. Moreover, in
2013 we introduced measures to reduce the volume of
goods transported by airfreight.
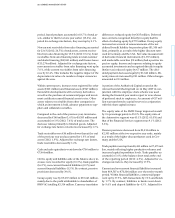
Carbon emissions reduced across the fleet
The Efficient Dynamics technology package has been
helping us reduce the amount of CO2 our vehicles emit
for many years. The 100 % electrically powered BMW i3
was added to the BMW Group’s vehicle fleet in 2013.
With increasing electrification, including that achieved
by means of hybrid technology, we will continue to
take a leading role in the lowering of carbon emissions
and fuel consumption. Looking into the future, these
technologies represent an important basis for fulfilling
legally mandatory carbon and consumption limits.
The average carbon emissions of the vehicles we sold in
Europe fell by 37 % from 1995 to 2013. The BMW Group’s
fleet of new vehicles sold in Europe consumed an average
of 4.8 litres of diesel per 100 km and 6.2 litres of petrol
respectively. The average carbon emissions in our cars
sold in Europe (EU 27) stood at 133 grams per kilometre
during the year under report. We also lead the field
among German premium-segment manufacturers with
carbon emissions of 139 g / km. In 2013 the BMW Group’s
fleet already included 39 models using less than 120 g
CO2 / km. Our efficient technologies have given us a
competitive edge, particularly in markets governed by
a
CO2-based vehicle tax.
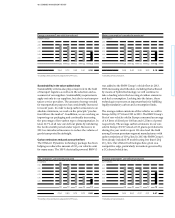
CO2 emissions* per vehicle produced
in t / vehicle
0.90
0.85
0.80
0.75
0.70
0.65
09 10 11 12 13
0.94 0.89 0.75 0.72 0.68
* Excluding contract production, adjusted for CHP losses.
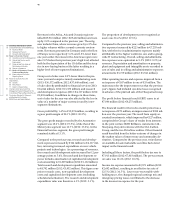
Process wastewater* per vehicle produced
in m3 / vehicle
0.70
0.60
0.50
0.40
0.30
0.20
09 10 11 12 13
0.64 0.60 0.57 0.51 0.47
* Excluding contract production.