BMW 2013 Annual Report Download - page 163
Download and view the complete annual report
Please find page 163 of the 2013 BMW annual report below. You can navigate through the pages in the report by either clicking on the pages listed below, or by using the keyword search tool below to find specific information within the annual report.-
 1
1 -
2
-
3
-
4
-
5
-
6
-
7
-
8
-
9
-
10
-
11
-
12
-
13
-
14
-
15
-
16
-
17
-
18
-
19
-
20
-
21
-
22
-
23
-
24
-
25
-
26
-
27
-
28
-
29
-
30
-
31
-
32
-
33
-
34
-
35
-
36
-
37
-
38
-
39
-
40
-
41
-
42
-
43
-
44
-
45
-
46
-
47
-
48
-
49
-
50
-
51
-
52
-
53
-
54
-
55
-
56
-
57
-
58
-
59
-
60
-
61
-
62
-
63
-
64
-
65
-
66
-
67
-
68
-
69
-
70
-
71
-
72
-
73
-
74
-
75
-
76
-
77
-
78
-
79
-
80
-
81
-
82
-
83
-
84
-
85
-
86
-
87
-
88
-
89
-
90
-
91
-
92
-
93
-
94
-
95
-
96
-
97
-
98
-
99
-
100
-
101
-
102
-
103
-
104
-
105
-
106
-
107
-
108
-
109
-
110
-
111
-
112
-
113
-
114
-
115
-
116
-
117
-
118
-
119
-
120
-
121
-
122
-
123
-
124
-
125
-
126
-
127
-
128
-
129
-
130
-
131
-
132
-
133
-
134
-
135
-
136
-
137
-
138
-
139
-
140
-
141
-
142
-
143
-
144
-
145
-
146
-
147
-
148
-
149
-
150
-
151
-
152
-
 153
153 -
 154
154 -
 155
155 -
 156
156 -
 157
157 -
 158
158 -
 159
159 -
 160
160 -
 161
161 -
 162
162 -
 163
163 -
 164
164 -
 165
165 -
 166
166 -
 167
167 -
 168
168 -
 169
169 -
 170
170 -
 171
171 -
 172
172 -
 173
173 -
174
-
175
-
176
-
177
-
178
-
179
-
180
-
181
-
182
-
183
-
184
-
185
-
186
-
187
-
188
-
189
-
190
-
191
-
192
-
193
-
194
-
195
-
196
-
197
-
198
-
199
-
200
-
201
-
202
-
203
-
204
-
205
-
206
-
207
-
208
 |
 |
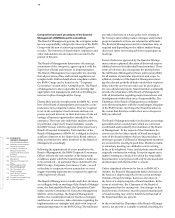
163 GROUP FINANCIAL STATEMENTS
Financial Other Entities Reconciliation to Group
Services Group figures
2013 2012 2013 2012* 2013 2012* 2013 2012*
18,276 17,869 2 2 – – 76,058 76,848 External revenues
1,598 1,681 4 3 – 15,955 – 14,405 – – Inter-segment revenues
19,874 19,550 6 5 – 15,955 – 14,405 76,058 76,848 Total revenues
1,639 1,561 164 3 – 626 – 1,369 7,913 7,803 Segment result
17,484 15,988 – – – 4,325 – 2,901 19,879 18,537 Capital expenditure on non-current assets
7,021 6,112 – – – 3,787 – 1,838 6,954 7,780 Depreciation and amortisation on non-current assets
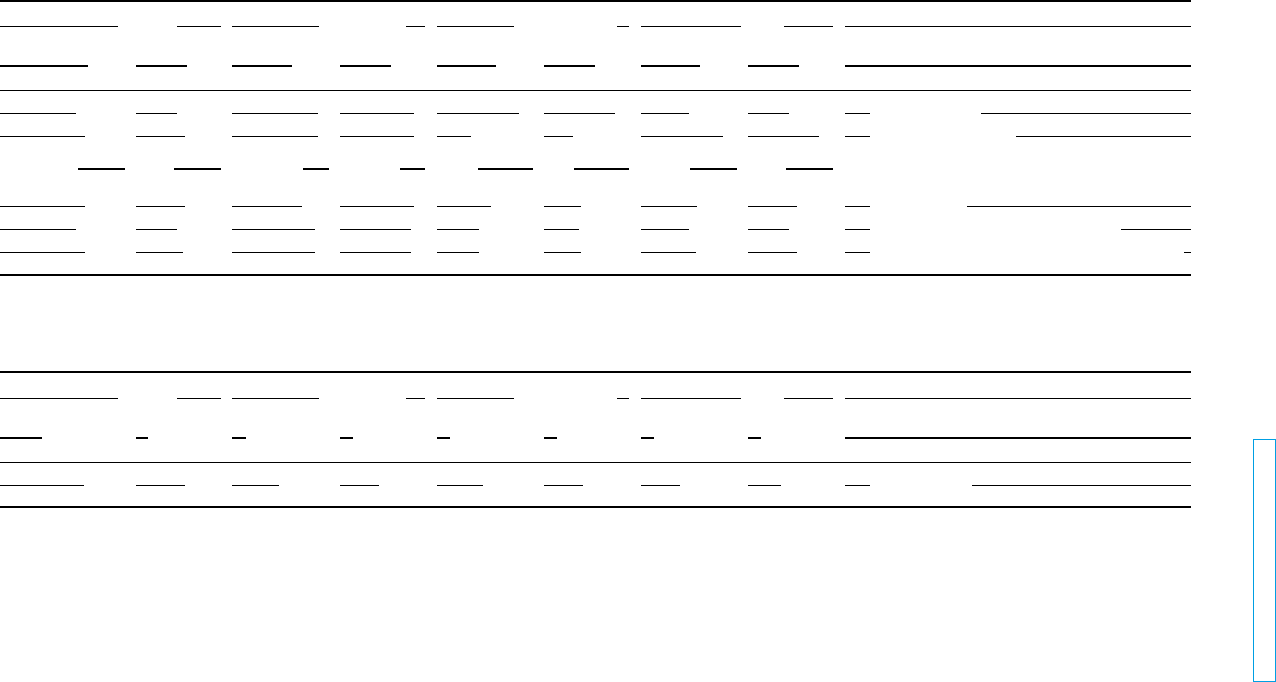
Financial Other Entities Reconciliation to Group
Services Group figures
31. 12. 2013 31. 12. 2012* 31. 12. 2013 31. 12. 2012 31. 12. 2013 31. 12. 2012* 31. 12. 2013 31. 12. 2012*
8,407 7,633 54,250 50,685 64,958 62,121 138,368 131,835 Segment assets