BMW 2013 Annual Report Download - page 92
Download and view the complete annual report
Please find page 92 of the 2013 BMW annual report below. You can navigate through the pages in the report by either clicking on the pages listed below, or by using the keyword search tool below to find specific information within the annual report.-
 1
1 -
2
-
3
-
4
-
5
-
6
-
7
-
8
-
9
-
10
-
11
-
12
-
13
-
14
-
15
-
16
-
17
-
18
-
19
-
20
-
21
-
22
-
23
-
24
-
25
-
26
-
27
-
28
-
29
-
30
-
31
-
32
-
33
-
34
-
35
-
36
-
37
-
38
-
39
-
40
-
41
-
42
-
43
-
44
-
45
-
46
-
47
-
48
-
49
-
50
-
51
-
52
-
53
-
54
-
55
-
56
-
57
-
58
-
59
-
60
-
61
-
62
-
63
-
64
-
65
-
66
-
67
-
68
-
69
-
70
-
71
-
72
-
73
-
74
-
75
-
76
-
77
-
78
-
79
-
80
-
81
-
 82
82 -
 83
83 -
 84
84 -
 85
85 -
 86
86 -
 87
87 -
 88
88 -
 89
89 -
 90
90 -
 91
91 -
 92
92 -
 93
93 -
 94
94 -
 95
95 -
 96
96 -
 97
97 -
 98
98 -
 99
99 -
 100
100 -
 101
101 -
 102
102 -
103
-
104
-
105
-
106
-
107
-
108
-
109
-
110
-
111
-
112
-
113
-
114
-
115
-
116
-
117
-
118
-
119
-
120
-
121
-
122
-
123
-
124
-
125
-
126
-
127
-
128
-
129
-
130
-
131
-
132
-
133
-
134
-
135
-
136
-
137
-
138
-
139
-
140
-
141
-
142
-
143
-
144
-
145
-
146
-
147
-
148
-
149
-
150
-
151
-
152
-
153
-
154
-
155
-
156
-
157
-
158
-
159
-
160
-
161
-
162
-
163
-
164
-
165
-
166
-
167
-
168
-
169
-
170
-
171
-
172
-
173
-
174
-
175
-
176
-
177
-
178
-
179
-
180
-
181
-
182
-
183
-
184
-
185
-
186
-
187
-
188
-
189
-
190
-
191
-
192
-
193
-
194
-
195
-
196
-
197
-
198
-
199
-
200
-
201
-
202
-
203
-
204
-
205
-
206
-
207
-
208
 |
 |

92
88 GROUP FINANCIAL STATEMENTS
88 Income Statements
88 Statement of
Comprehensive Income
90 Balance Sheets
92 Cash Flow Statements
94 Group Statement of Changes in
Equity
96 Notes
96 Accounting Principles and
Policies
114 Notes to the Income Statement
121 Notes to the Statement
of Comprehensive Income
122
Notes to the Balance Sheet
145 Other Disclosures
161 Segment Information
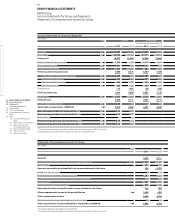
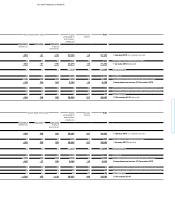
BMW Group
Cash Flow Statements for Group and Segments
Note Group
in € million 2013 2012
1, 2
Net profit 5,340 5,111
Reconciliation between net profit and cash inflow / outflow from operating activities
Current tax 2,435 2,908
Other interest and similar income / expenses 126 – 4
Depreciation and amortisation of other tangible, intangible and investment assets 3,830 3,716
Change in provisions 479 443
Change in leased products – 2,048 – 1,421
Change in receivables from sales financing – 4,501 – 3,988
Change in deferred taxes 138 – 216
Other non-cash income and expense items – 551 407
Gain / loss on disposal of tangible and intangible assets and marketable securities – 22 – 16
Result from equity accounted investments – 398 – 271
Changes in working capital 983 1,755
Change in inventories – 192 – 108
Change in trade receivables 22 744
Change in trade payables 1,153 1,119
Change in other operating assets and liabilities 453 – 1,065
Income taxes paid – 2,787 – 2,462
Interest received 137 179
Cash inflow / outflow from operating activities 43
3,614 5,076
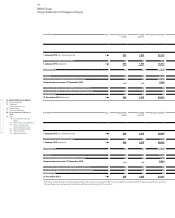
Investment in intangible assets and property, plant and equipment – 6,669 – 5,236
Proceeds from the disposal of intangible assets and property, plant and equipment 22 42
Expenditure for investments – 90 – 171
Proceeds from the disposal of investments 137 107
Cash payments for the purchase of marketable securities – 3,631 – 1,265
Cash proceeds from the sale of marketable securities 3,250 1,090
Cash inflow / outflow from investing activities 43
– 6,981 – 5,433
Issue / buy-back of treasury shares – –
Payments into equity 17 19
Payment of dividend for the previous year – 1,653 – 1,516
Intragroup financing and equity transactions – –
Interest paid – 122 – 102
Proceeds from the issue of bonds 8,982 7,977
Repayment of bonds – 7,242 – 6,727
Proceeds from new non-current other financial liabilities 6,626 7,427
Repayment of non-current other financial liabilities – 4,996 – 5,498
Change in current other financial liabilities – 721 230
Change in commercial paper 1,812 – 858
Cash inflow / outf low from f inancing activities 43
2,703 952
Effect of exchange rate on cash and cash equivalents – 89 – 14
Effect of changes in composition of Group on cash and cash equivalents 47 13
Change in cash and cash equivalents 43
– 706 594
Cash and cash equivalents as at 1 January 8,370 7,776
Cash and cash equivalents as at 31 December 7,664 8,370
1 Prior year figures have been adjusted in accordance with the revised version of IAS 19, see note 7.
2 Prior year figures have been adjusted in accordance with the change in presentation described in note 43.
3 Interest relating to financial services business is classified as revenues / cost of sales.