BMW 2013 Annual Report Download - page 25
Download and view the complete annual report
Please find page 25 of the 2013 BMW annual report below. You can navigate through the pages in the report by either clicking on the pages listed below, or by using the keyword search tool below to find specific information within the annual report.-
 1
1 -
2
-
3
-
4
-
5
-
6
-
7
-
8
-
9
-
10
-
11
-
12
-
13
-
14
-
 15
15 -
 16
16 -
 17
17 -
 18
18 -
 19
19 -
 20
20 -
 21
21 -
 22
22 -
 23
23 -
 24
24 -
 25
25 -
 26
26 -
 27
27 -
 28
28 -
 29
29 -
 30
30 -
 31
31 -
 32
32 -
 33
33 -
 34
34 -
 35
35 -
36
-
37
-
38
-
39
-
40
-
41
-
42
-
43
-
44
-
45
-
46
-
47
-
48
-
49
-
50
-
51
-
52
-
53
-
54
-
55
-
56
-
57
-
58
-
59
-
60
-
61
-
62
-
63
-
64
-
65
-
66
-
67
-
68
-
69
-
70
-
71
-
72
-
73
-
74
-
75
-
76
-
77
-
78
-
79
-
80
-
81
-
82
-
83
-
84
-
85
-
86
-
87
-
88
-
89
-
90
-
91
-
92
-
93
-
94
-
95
-
96
-
97
-
98
-
99
-
100
-
101
-
102
-
103
-
104
-
105
-
106
-
107
-
108
-
109
-
110
-
111
-
112
-
113
-
114
-
115
-
116
-
117
-
118
-
119
-
120
-
121
-
122
-
123
-
124
-
125
-
126
-
127
-
128
-
129
-
130
-
131
-
132
-
133
-
134
-
135
-
136
-
137
-
138
-
139
-
140
-
141
-
142
-
143
-
144
-
145
-
146
-
147
-
148
-
149
-
150
-
151
-
152
-
153
-
154
-
155
-
156
-
157
-
158
-
159
-
160
-
161
-
162
-
163
-
164
-
165
-
166
-
167
-
168
-
169
-
170
-
171
-
172
-
173
-
174
-
175
-
176
-
177
-
178
-
179
-
180
-
181
-
182
-
183
-
184
-
185
-
186
-
187
-
188
-
189
-
190
-
191
-
192
-
193
-
194
-
195
-
196
-
197
-
198
-
199
-
200
-
201
-
202
-
203
-
204
-
205
-
206
-
207
-
208
 |
 |

25 COMBINED MANAGEMENT REPORT
Currency markets
At an annual average rate of US dollar 1.32 to the euro
in 2013, the US dollar exchange rate was slightly higher
than one year earlier and fluctuated within a relatively
narrow corridor over the twelve-month period. The euro
also appreciated slightly against the British pound
with
an annual average rate of British pound 0.85 to the
euro. Even though the European Central Bank (ECB)
loosened monetary policy still further during the fourth
quarter of 2013 by reducing the reference interest rate
to 0.25 %, the perception on the markets is nonetheless
that the ECB is following a more restrictive course
than
the Reserve Bank in the USA and the Bank of Eng-
land in the UK. Since the exchange rate of the Chinese
renminbi remains more or less coupled to that of the US
dollar, its value against the euro fell only marginally in
2013, with an annual average exchange rate of Chinese
renminbi 8.14 to the euro. By contrast, the Japanese yen
and the currencies of numerous emerging economies,
such as India, Brazil and South Africa, lost a good deal of
ground against the euro. The annual average exchange
rate of the Russian rouble was 42.30 to the euro, making
it 6 % weaker than in the previous year.
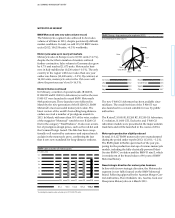
Energy and commodity prices
With the situation in the Middle East still unsettled, the
price of crude oil stagnated at a high level throughout
2013: the annual average price of Brent and WTI crude
oil
was US dollar 108 and US dollar 98 per barrel respec-
tively. For the most part, metal prices fell slightly during
the course of the year, partly reflecting the reduction
of
funds invested in commodities and partly due to the
fact that capacity utilisation rates in the steel and metals
industries were relatively poor, particularly in Europe
under the pervading influence of the euro crisis.
Sector-specific environment
Within an increasingly competitive environment, the
BMW Group was again able to assert its leading position
in the premium market in 2013, benefiting from its
innovative strength on the one hand and from a well-
balanced regional spread of sales on the other. Global
diversification means that downturns in individual
markets can be compensated to a large degree by faster
growth rates in other regions.
Automobile markets
The number of passenger cars and light commercial
vehicles sold worldwide rose by 5.1 % to 76.5 million
units in 2013, primarily on the back of increased de-
mand in the USA and China. The strongest momentum
for growth was generated in China, where the market
grew by 2.5 million to 15.8 million units (+ 19.2 %).
The
next fastest growing market was the USA, where
total sales rose by 1.1 million units to 15.6 million units
(+ 7.6 %).
In Europe, the number of new registrations fell once
again in 2013 (12.2 million units; – 1.8 %). With an
above-average decrease of 4.2 %, new registrations in
Germany – the region’s largest single market – fell to
approximately 2.9 million units. The contraction in
France (– 5.5 %) and Italy (– 7.8 %) was even more
pro-
Oil price trend
Price per barrel of Brent Crude
140
120
100
80
60
40
20
09 10 11 12 13
Source: Reuters.
Price in €
Price in US Dollar
Steel price trend
(Index: January 2009 = 100)
150
140
130
120
110
100
90
80
09 10 11 12 13
Source: Working Group for the Iron and Metal Processing Industry.