BMW 2013 Annual Report Download - page 202
Download and view the complete annual report
Please find page 202 of the 2013 BMW annual report below. You can navigate through the pages in the report by either clicking on the pages listed below, or by using the keyword search tool below to find specific information within the annual report.-
 1
1 -
2
-
3
-
4
-
5
-
6
-
7
-
8
-
9
-
10
-
11
-
12
-
13
-
14
-
15
-
16
-
17
-
18
-
19
-
20
-
21
-
22
-
23
-
24
-
25
-
26
-
27
-
28
-
29
-
30
-
31
-
32
-
33
-
34
-
35
-
36
-
37
-
38
-
39
-
40
-
41
-
42
-
43
-
44
-
45
-
46
-
47
-
48
-
49
-
50
-
51
-
52
-
53
-
54
-
55
-
56
-
57
-
58
-
59
-
60
-
61
-
62
-
63
-
64
-
65
-
66
-
67
-
68
-
69
-
70
-
71
-
72
-
73
-
74
-
75
-
76
-
77
-
78
-
79
-
80
-
81
-
82
-
83
-
84
-
85
-
86
-
87
-
88
-
89
-
90
-
91
-
92
-
93
-
94
-
95
-
96
-
97
-
98
-
99
-
100
-
101
-
102
-
103
-
104
-
105
-
106
-
107
-
108
-
109
-
110
-
111
-
112
-
113
-
114
-
115
-
116
-
117
-
118
-
119
-
120
-
121
-
122
-
123
-
124
-
125
-
126
-
127
-
128
-
129
-
130
-
131
-
132
-
133
-
134
-
135
-
136
-
137
-
138
-
139
-
140
-
141
-
142
-
143
-
144
-
145
-
146
-
147
-
148
-
149
-
150
-
151
-
152
-
153
-
154
-
155
-
156
-
157
-
158
-
159
-
160
-
161
-
162
-
163
-
164
-
165
-
166
-
167
-
168
-
169
-
170
-
171
-
172
-
173
-
174
-
175
-
176
-
177
-
178
-
179
-
180
-
181
-
182
-
183
-
184
-
185
-
186
-
187
-
188
-
189
-
190
-
191
-
 192
192 -
 193
193 -
 194
194 -
 195
195 -
 196
196 -
 197
197 -
 198
198 -
 199
199 -
 200
200 -
 201
201 -
 202
202 -
 203
203 -
 204
204 -
 205
205 -
 206
206 -
 207
207 -
 208
208
 |
 |

202
196 OTHER INFORMATION
196 BMW Group Ten-year Comparison
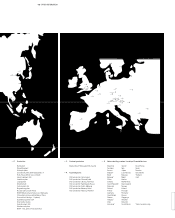
198 BMW Group Locations
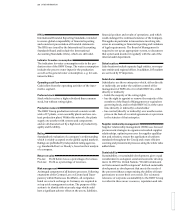
200 Glossary
202 Index
203 Index of Graphs
204 Financial Calendar
205 Contacts
Index
A
Accounting policies 99 et seq.
Apprentices 42
Automotive segment 29 et seq.
B
Balance sheet structure 54
Bonds 52 et seq., 142 et seq.
C
Capital expenditure 4, 48, 50 et seq.
Cash and cash equivalents 50 et seq., 53 et seq.,
104, 130
Cash flow 4, 50 et seq., 92 et seq.,175 et seq.
Cash flow statement 50 et seq., 92 et seq., 157 et seq.
CFRP 32, 38, 40, 44
CO2 emissions 28, 44 et seq., 66, 70
Compensation Report 185 et seq.
Compliance 180 et seq.
Connected Drive 38
Consolidated companies entity 97 et seq.
Consolidation principles 98
Contingent liabilities 145
Corporate Governance 166 et seq.
Cost of materials 56 et seq.
Cost of sales 48, 99, 114
D
Dealer organisation /dealerships 19, 41
Declaration with respect to the Corporate Governance
Code 167
Dividend 86, 119
Dow Jones Sustainability Index World 44
E
Earnings per share 99, 119
Efficient Dynamics 38
Employees 42 et seq.
Equity 53 et seq., 131 et seq.
Exchange rates 25, 64, 98, 155 et seq.
F
Financial assets 53, 103, 127 et seq.
Financial instruments 102 et seq., 146 et seq.
Financial liabilities 51 et seq., 55 et seq., 104,
142 et seq.
Financial result 48 et seq., 59, 116
Financial Services segment 36 et seq.
Fleet emissions 27 et seq., 45, 66
G
Group tangible, intangible and investment
assets 122 et seq.
I
Income statement 47, 88 et seq., 114 et seq.
Income taxes 48, 103, 116 et seq., 141
Intangible assets 48, 50, 54, 100, 124
Inventories 53, 55, 60, 103 et seq., 129
Investments accounted for using the equity method
and other investments 101, 125
K
Key data per share 86
L
Lease business 36 et seq.
Leased products 125
Locations 198 et seq.
M
Mandates of members of the Board of
Management 168
Mandates of members of the Supervisory
Board 169 et seq.
Marketable securities 102, 127 et seq.
Motorcycles segment 35
N
Net profit 4, 47 et seq.
New financial reporting rules 110 et seq.
O
Other financial result 116
Other investments 125 et seq.
Other operating income and expenses 115
Other provisions 141
Outlook 63 et seq.
P
Pension provisions 55, 61, 104, 133 et seq.
Performance indicators 20 et seq., 27 et seq., 59,
62, 65 et seq.
Personnel costs 119
Production 32 et seq.
Production network 32 et seq.
Profit before financial result 4, 47 et seq.
Profit before tax 4, 27 et seq., 48 et seq., 65
Property, plant and equipment 48, 50, 53 et seq.,
100, 124
Purchasing 40