BMW 2013 Annual Report Download - page 48
Download and view the complete annual report
Please find page 48 of the 2013 BMW annual report below. You can navigate through the pages in the report by either clicking on the pages listed below, or by using the keyword search tool below to find specific information within the annual report.-
 1
1 -
2
-
3
-
4
-
5
-
6
-
7
-
8
-
9
-
10
-
11
-
12
-
13
-
14
-
15
-
16
-
17
-
18
-
19
-
20
-
21
-
22
-
23
-
24
-
25
-
26
-
27
-
28
-
29
-
30
-
31
-
32
-
33
-
34
-
35
-
36
-
37
-
 38
38 -
 39
39 -
 40
40 -
 41
41 -
 42
42 -
 43
43 -
 44
44 -
 45
45 -
 46
46 -
 47
47 -
 48
48 -
 49
49 -
 50
50 -
 51
51 -
 52
52 -
 53
53 -
 54
54 -
 55
55 -
 56
56 -
 57
57 -
 58
58 -
59
-
60
-
61
-
62
-
63
-
64
-
65
-
66
-
67
-
68
-
69
-
70
-
71
-
72
-
73
-
74
-
75
-
76
-
77
-
78
-
79
-
80
-
81
-
82
-
83
-
84
-
85
-
86
-
87
-
88
-
89
-
90
-
91
-
92
-
93
-
94
-
95
-
96
-
97
-
98
-
99
-
100
-
101
-
102
-
103
-
104
-
105
-
106
-
107
-
108
-
109
-
110
-
111
-
112
-
113
-
114
-
115
-
116
-
117
-
118
-
119
-
120
-
121
-
122
-
123
-
124
-
125
-
126
-
127
-
128
-
129
-
130
-
131
-
132
-
133
-
134
-
135
-
136
-
137
-
138
-
139
-
140
-
141
-
142
-
143
-
144
-
145
-
146
-
147
-
148
-
149
-
150
-
151
-
152
-
153
-
154
-
155
-
156
-
157
-
158
-
159
-
160
-
161
-
162
-
163
-
164
-
165
-
166
-
167
-
168
-
169
-
170
-
171
-
172
-
173
-
174
-
175
-
176
-
177
-
178
-
179
-
180
-
181
-
182
-
183
-
184
-
185
-
186
-
187
-
188
-
189
-
190
-
191
-
192
-
193
-
194
-
195
-
196
-
197
-
198
-
199
-
200
-
201
-
202
-
203
-
204
-
205
-
206
-
207
-
208
 |
 |

48
18 COMBINED MANAGEMENT REPORT
18
General Information on the BMW Group
18 Business Model
20 Management System
23 Research and Development
24 Report on Economic Position
24 Overall Assessment by Management
24 General and Sector-specific
Environment
27
Financial and Non-financial
Performance Indicators
29 Review of Operations
47 Results of Operations, Financial
Position and Net Assets
62 Events after the End of the
Reporting Period
63 Report on Outlook, Risks and
Opportunities
63 Outlook
68 Risks Report
77 Report on Opportunities
81 Internal Control System and Risk
Management System Relevant for
the
Consolidated Financial Reporting Process
82 Disclosures Relevant for Takeovers
and Explanatory Comments
85
BMW Stock and Capital Markets
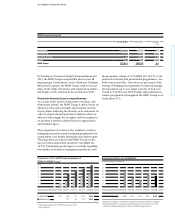
Revenues in the Africa, Asia and Oceania region to-
talled € 25,916 million (2012: € 25,420 million) and were
up by 2.0 % compared to the previous year. These fig-
ures include China, where revenues grew by 6.2 % due
to higher volumes within a sound economic environ-
ment. Revenues generated in Germany and in the Rest
of Europe were respectively 3.2 % and 1.8 % lower than
one year earlier. Revenues in the Americas region were
also 2.9 % below their previous year’s high level, affected
both by the depreciation of the US dollar and the steep
rise in new leasing business (the latter resulting in a
higher level of inter-segment eliminations).
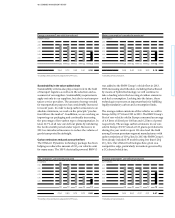
Group cost of sales were 0.9 % lower than in the pre-
vious year and comprise mainly manufacturing costs
(2013: € 36,572 million; 2012: € 37,648 million), cost
of sales directly attributable to financial services (2013:
€ 14,044 million; 2012: € 13,370 million) and research
and development expenses (2013: € 4,117 million; 2012:
€ 3,993 million). In addition to changes in these items,
cost of sales for the year was also affected by the loss in
value of a number of major currencies and by inter-
segment
eliminations.
Gross profit fell by 1.4 % to € 15,274 million, resulting in
a gross profit margin of 20.1 % (2012: 20.2 %).
The gross profit margin recorded by the Automotive
segment was 18.2 % (2012: 19.5 %), while that of the
Motorcycles segment was 16.7 % (2012: 17.0 %). In the
Financial Services segment, the gross profit margin
remained stable at 13.1 %.
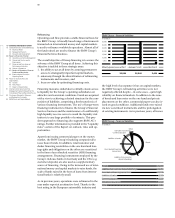
Compared to the previous year, research and
develop-
ment expenses increased by € 124 million to € 4,117
mil-
lion, mirroring increased expenditure on new vehicle
projects and technologies. As a percentage of revenues,
the research and development ratio increased by 0.2 per-
centage
points to 5.4 %. Research and development
ex-
pense
includes amortisation of capitalised development
costs amounting to € 1,069 million (2012: € 1,130 million).
Total research and development expenditure amounted
to € 4,792 million (2012: € 3,952 million). This figure com-
prises
research costs, non-capitalised development
costs and capitalised development costs (excluding
scheduled amortisation). The research and development
expenditure ratio was therefore 6.3 % (2012: 5.1 %).
The proportion of development costs recognised as
assets was 36.4 % (2012: 27.6 %).
Compared to the previous year, selling and administra-
tive expenses increased by € 223 million to € 7,255 mil-
lion, with the rise in administrative expenses mainly
attributable to the higher workforce size and to group-
wide IT restructuring. Overall, selling and administra-
tive expenses were equivalent to 9.5 % (2012: 9.2 %) of
revenues. Depreciation and amortisation on property,
plant and equipment and intangible assets recorded in
cost of sales and in selling and administrative expenses
amounted to € 3,739 million (2012: € 3,541 million).
Other operating income and expenses improved from a
net expense of € 187 million to one of € 33 million. The
main reason for the improvement was that the previous
year’s figures had included one-time losses recognised
in advance of the planned sale of the Husqvarna Group.
The profit before financial result (EBIT) came in at
€ 7,986 million (2012: € 8,275 million).
The financial result for the twelve-month period was a
net expense of € 73 million, an improvement of € 399 mil-
lion over the previous year. The result from equity ac-
counted investments, which improved by € 127 million,
comprised the Group’s share of results from interests
in
the joint venture BMW Brilliance Automotive Ltd.,
Shenyang, the joint ventures with the SGL Carbon
Group, and the two DriveNow entities. Other financial
result benefited from the better outcome of changes in
the market values of interest rate and commodity de-
rivatives.
Compared to the previous year, write-downs
on available-for-sale
marketable securities had a lower
impact on the financial
result.
Including all these factors, the profit before tax rose to
€ 7,913 million (2012: € 7,803 million). The pre-tax return
on sales was 10.4 % (2012:
10.2 %).
Income tax expense amounted to € 2,573 million (2012:
€ 2,692 million), resulting in an effective tax rate of
32.5 % (2012: 34.5 %). Lower non-recoverable with-
holding taxes, the changed regional earnings mix and
intergroup pricing issues contributed to the decrease
in the income tax expense for the year.