BMW 2013 Annual Report Download - page 134
Download and view the complete annual report
Please find page 134 of the 2013 BMW annual report below. You can navigate through the pages in the report by either clicking on the pages listed below, or by using the keyword search tool below to find specific information within the annual report.-
 1
1 -
2
-
3
-
4
-
5
-
6
-
7
-
8
-
9
-
10
-
11
-
12
-
13
-
14
-
15
-
16
-
17
-
18
-
19
-
20
-
21
-
22
-
23
-
24
-
25
-
26
-
27
-
28
-
29
-
30
-
31
-
32
-
33
-
34
-
35
-
36
-
37
-
38
-
39
-
40
-
41
-
42
-
43
-
44
-
45
-
46
-
47
-
48
-
49
-
50
-
51
-
52
-
53
-
54
-
55
-
56
-
57
-
58
-
59
-
60
-
61
-
62
-
63
-
64
-
65
-
66
-
67
-
68
-
69
-
70
-
71
-
72
-
73
-
74
-
75
-
76
-
77
-
78
-
79
-
80
-
81
-
82
-
83
-
84
-
85
-
86
-
87
-
88
-
89
-
90
-
91
-
92
-
93
-
94
-
95
-
96
-
97
-
98
-
99
-
100
-
101
-
102
-
103
-
104
-
105
-
106
-
107
-
108
-
109
-
110
-
111
-
112
-
113
-
114
-
115
-
116
-
117
-
118
-
119
-
120
-
121
-
122
-
123
-
 124
124 -
 125
125 -
 126
126 -
 127
127 -
 128
128 -
 129
129 -
 130
130 -
 131
131 -
 132
132 -
 133
133 -
 134
134 -
 135
135 -
 136
136 -
 137
137 -
 138
138 -
 139
139 -
 140
140 -
 141
141 -
 142
142 -
 143
143 -
 144
144 -
145
-
146
-
147
-
148
-
149
-
150
-
151
-
152
-
153
-
154
-
155
-
156
-
157
-
158
-
159
-
160
-
161
-
162
-
163
-
164
-
165
-
166
-
167
-
168
-
169
-
170
-
171
-
172
-
173
-
174
-
175
-
176
-
177
-
178
-
179
-
180
-
181
-
182
-
183
-
184
-
185
-
186
-
187
-
188
-
189
-
190
-
191
-
192
-
193
-
194
-
195
-
196
-
197
-
198
-
199
-
200
-
201
-
202
-
203
-
204
-
205
-
206
-
207
-
208
 |
 |

134
88 GROUP FINANCIAL STATEMENTS
88 Income Statements
88 Statement of
Comprehensive Income
90 Balance Sheets
92 Cash Flow Statements
94 Group Statement of Changes in
Equity
96 Notes
96 Accounting Principles and
Policies
114 Notes to the Income Statement
121 Notes to the Statement
of Comprehensive Income
122
Notes to the Balance Sheet
145 Other Disclosures
161 Segment Information
Past service cost arises where a BMW Group company
introduces a defined benefit plan or changes the
bene-
fits payable under an existing plan. These costs are
recognised immediately in the income statement.
Simi-
larly, gains and losses arising on the settlement of a
defined benefit plan are recognised immediately in the
income statement.
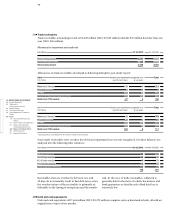
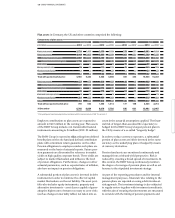
The defined benefit obligation is calculated on an actu-
arial basis. The actuarial computation requires the use
of estimates and assumptions, which depend on the
economic situation in each particular country. The most
important assumptions applied by the BMW Group are
shown below. The following weighted average values
have been used for Germany, the United Kingdom and
other countries:
31 December Germany United Kingdom Other
in % 2013 2012 2013 2012 2013 2012
Discount rate 3.50 3.00 4.40 4.25 4.46 3.82
Pension level trend 2.00 2.18 3.32 2.31 0.05 0.09
In Germany, the so-called “pension entitlement trend”
(Fest betragstrend) also represents a significant actuar-
ial assumption for the purposes of determining bene-
fits
payable at retirement and was left unchanged at
2.0 %.
The salary level trend is a less sensitive assump-
tion within the BMW Group. The calculation of the
pension
level trend was reviewed in conjunction with
the application of the revised IAS 19 and brought onto a
standardised footing worldwide. In this context, the
assumption applied in the UK now also takes account
The following mortality tables are applied in countries, in which the BMW Group has significant defined benefit plans:
of restrictions due to caps and floors. For the purposes
of calculating the average rate, countries with pension
payments not linked to inflation or with one-off pay-
ments are also now included. The assumptions applied
in the previous year were adjusted accordingly.
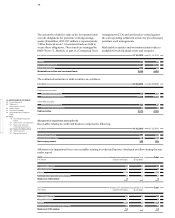
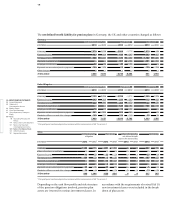
Based on the measurement principles contained in
IAS 19, the following balance sheet carrying amounts
apply to the Group’s pension plans:
31 December Germany United Kingdom Other Total
in € million 2013 2012 2013 2012* 2013 2012* 2013 2012*
Present value of defined benefit obligations 7,400 7,974 7,409 7,137 949 1,144 15,758 16,255
Fair value of plan assets 6,749 6,064 6,076 5,782 636 601 13,461 12,447
Effect of limiting net defined benefit asset to asset ceiling – – – – 4 4 4 4
Carrying amounts at 31 December 651 1,910 1,333 1,355 317 547 2,301 3,812
thereof pension provision 652 1,910 1,333 1,355 318 548 2,303 3,813
thereof assets – 1 – – – – 1 – 1 – 2 – 1
* Prior year figures have been adjusted in accordance with the revised version of IAS 19, see note 7.
Germany Mortality Table 2005 G issued by Prof. K. Heubeck (with invalidity rates reduced by 50 %)
United Kingdom S1PA tables weighted accordingly, and S1NA tables minus 2 years, both with a minimum long term annual improvement allowance
USA RP2000 Mortality Table Projected with Scale AA