BMW 2013 Annual Report Download - page 24
Download and view the complete annual report
Please find page 24 of the 2013 BMW annual report below. You can navigate through the pages in the report by either clicking on the pages listed below, or by using the keyword search tool below to find specific information within the annual report.-
 1
1 -
2
-
3
-
4
-
5
-
6
-
7
-
8
-
9
-
10
-
11
-
12
-
13
-
 14
14 -
 15
15 -
 16
16 -
 17
17 -
 18
18 -
 19
19 -
 20
20 -
 21
21 -
 22
22 -
 23
23 -
 24
24 -
 25
25 -
 26
26 -
 27
27 -
 28
28 -
 29
29 -
 30
30 -
 31
31 -
 32
32 -
 33
33 -
 34
34 -
35
-
36
-
37
-
38
-
39
-
40
-
41
-
42
-
43
-
44
-
45
-
46
-
47
-
48
-
49
-
50
-
51
-
52
-
53
-
54
-
55
-
56
-
57
-
58
-
59
-
60
-
61
-
62
-
63
-
64
-
65
-
66
-
67
-
68
-
69
-
70
-
71
-
72
-
73
-
74
-
75
-
76
-
77
-
78
-
79
-
80
-
81
-
82
-
83
-
84
-
85
-
86
-
87
-
88
-
89
-
90
-
91
-
92
-
93
-
94
-
95
-
96
-
97
-
98
-
99
-
100
-
101
-
102
-
103
-
104
-
105
-
106
-
107
-
108
-
109
-
110
-
111
-
112
-
113
-
114
-
115
-
116
-
117
-
118
-
119
-
120
-
121
-
122
-
123
-
124
-
125
-
126
-
127
-
128
-
129
-
130
-
131
-
132
-
133
-
134
-
135
-
136
-
137
-
138
-
139
-
140
-
141
-
142
-
143
-
144
-
145
-
146
-
147
-
148
-
149
-
150
-
151
-
152
-
153
-
154
-
155
-
156
-
157
-
158
-
159
-
160
-
161
-
162
-
163
-
164
-
165
-
166
-
167
-
168
-
169
-
170
-
171
-
172
-
173
-
174
-
175
-
176
-
177
-
178
-
179
-
180
-
181
-
182
-
183
-
184
-
185
-
186
-
187
-
188
-
189
-
190
-
191
-
192
-
193
-
194
-
195
-
196
-
197
-
198
-
199
-
200
-
201
-
202
-
203
-
204
-
205
-
206
-
207
-
208
 |
 |
24
18 COMBINED MANAGEMENT REPORT
18
General Information on the
BMW
Group
18 Business Model
20 Management System
23 Research and Development
24 Report on Economic Position
24
Overall Assessment by Management
24 General and Sector-specific
Environment
27
Financial and Non-financial
Performance Indicators
29 Review of Operations
47 Results of Operations, Financial
Position and Net Assets
62 Events after the End of the
Reporting Period
63 Report on Outlook, Risks and
Opportunities
63 Outlook
68 Risks Report
77 Report on Opportunities
81 Internal Control System and Risk
Management System Relevant for
the
Consolidated Financial Reporting Process
82 Disclosures Relevant for Takeovers
and Explanatory Comments
85
BMW Stock and Capital Markets
Overall assessment by management
The BMW Group’s performance in 2013 was positive
overall and fully in line with our expectations. Good
progress was made in terms of results of operations,
financial position and net assets. This statement also
takes into account events after the end of the reporting
period.
General and sector-specific environment
General economic environment
After the downturn in the two preceding years, the
global economy stabilised over the course of 2013,
ending
with a moderate growth rate of approximately
2.4 %. Once again, the USA and China were the main-
stays of growth during the period under report. After
s
ix consecutive quarters of recession, the eurozone
finally managed to register its first minor positive
growth rates in the second half of 2013. Surprisingly
strong upturns in Japan and the United Kingdom
helped to stabilise the world economy. By contrast,
growth
in some of the major emerging economies,
such as India, Brazil and Russia, slowed significantly.
Speculation that the US Reserve Bank is likely to put a
brake on its expansionary monetary policy caused inter-
est rate expectations to rise on the world’s capital mar-
kets. As a consequence, some international investors
withdrew capital from emerging economies, reduced
in-
vestments in commodities and reallocated funds, pri-
marily in stock markets in the USA, Europe and Japan.
Practically all emerging economies registered
drops in
growth rates, sometimes significant, as a result.
High sovereign debt levels again exerted an influence
on economic developments, particularly in Europe. The
eurozone’s economy contracted overall by 0.4 % in 2013.
With the exception of Germany, where the growth rate
edged up to 0.4 %, economic growth remained weak in
the remainder of the region. France’s gross domestic
product (GDP) practically stagnated at a rate of 0.2 %,
while Italy (– 1.8 %) and Spain (– 1.3 %) both suffered an-
other year of recession. Whereas positive data coming
from Spain towards the end of 2013 suggest the re-
cessionary phase may be coming to an end, the eco-
nomic position in Italy and France remained tense to
the end.
The UK economy – Europe’s largest outside the euro-
zone which had been flat in the
previous year – re-
ported an upturn of 1.9 % in 2013, partly benefiting
from support for the property market in the form of
monetary and fiscal policies.
The economy in the USA grew surprisingly well in 2013,
registering a growth rate of 1.9 %. This positive
perfor-
mance was attributable entirely to the private sector,
with consumer spending and investments up again,
thanks to sharp improvements in the employment and
property markets. The public sector, by contrast, had
a negative impact on growth, owing firstly to further
spending consolidation and secondly to political dis-
agreement regarding the federal budget and debt ceiling.
Japan’s new government managed to keep the country
out of renewed recession by employing heavily
expan-
sionary monetary and fiscal policies, culminating in GDP
growth of 1.7 % for the full year 2013.
Despite a small decline in the growth rate, which stood
at 7.7 % in 2013, China nevertheless asserted its role
as the most dynamic of the world’s major economies.
Other emerging economies grew considerably more
slowly than expected. India’s growth rate of 4.7 % was
only about one half of the long-term prediction. Brazil
(2.3 %) and Russia (1.5 %) also fell well short of the growth
rates recorded one year earlier.
Report on Economic Position
Overall Assessment by Management
General and Sector-specific Environment
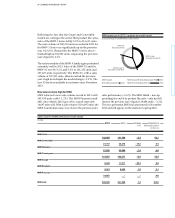
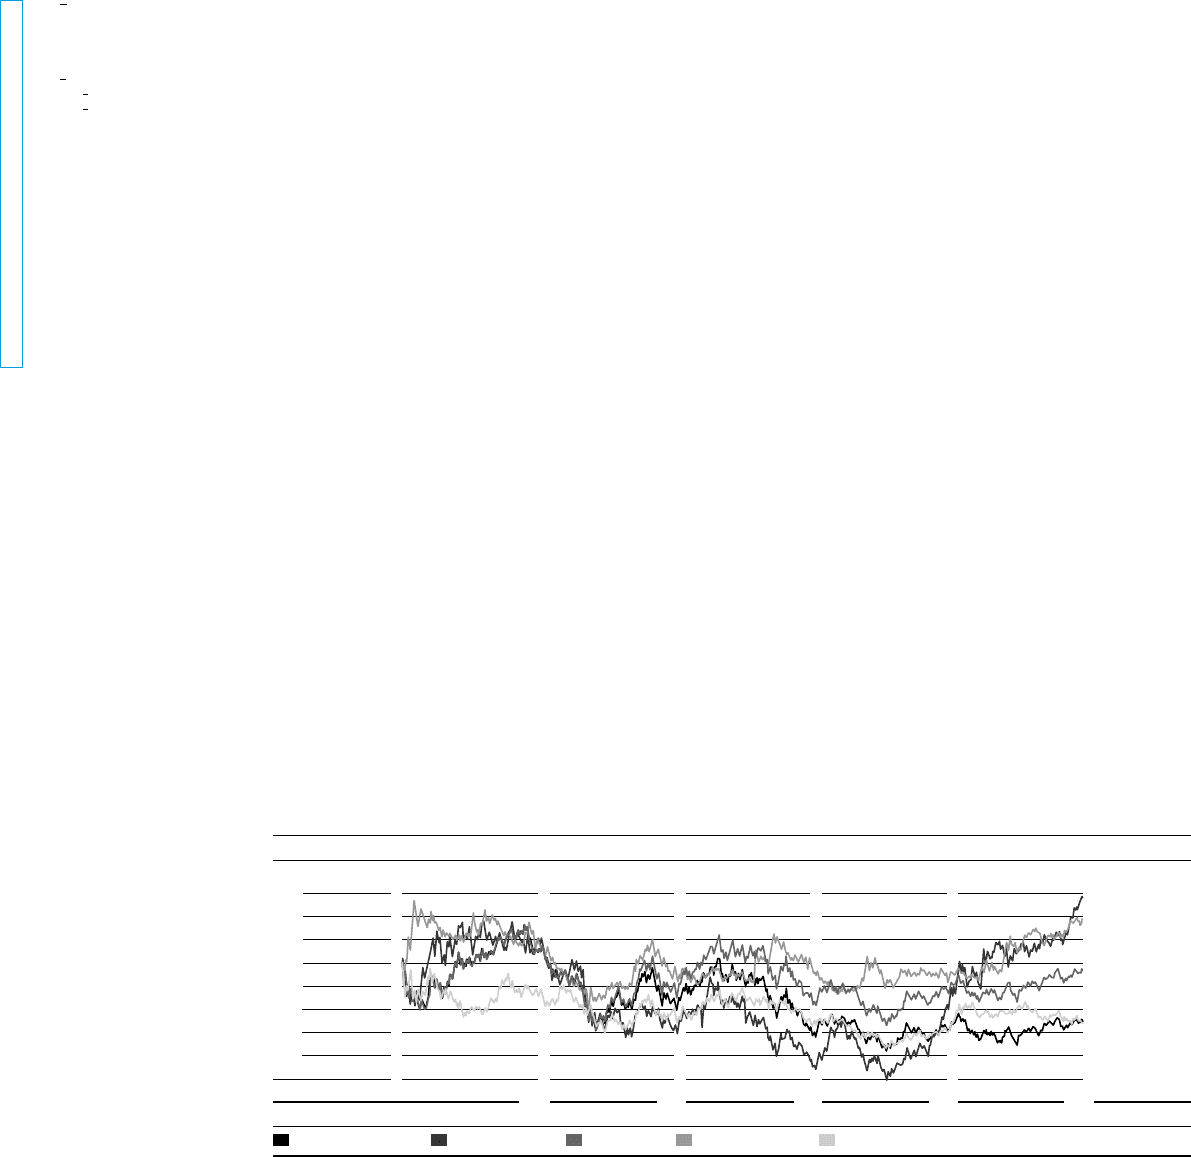
Exchange rates compared to the euro
(Index: 31 December 2008 = 100)
120
115
110
105
100
95
90
85
09 10 11 12 13
Source: Reuters.
British Pound
Russian Rouble
Chinese
Renminbi
Japanese Yen
US Dollar
Japanese Yen Russian RoubleUS DollarChinese Renminbi British Pound