BMW 2013 Annual Report Download - page 57
Download and view the complete annual report
Please find page 57 of the 2013 BMW annual report below. You can navigate through the pages in the report by either clicking on the pages listed below, or by using the keyword search tool below to find specific information within the annual report.-
 1
1 -
2
-
3
-
4
-
5
-
6
-
7
-
8
-
9
-
10
-
11
-
12
-
13
-
14
-
15
-
16
-
17
-
18
-
19
-
20
-
21
-
22
-
23
-
24
-
25
-
26
-
27
-
28
-
29
-
30
-
31
-
32
-
33
-
34
-
35
-
36
-
37
-
38
-
39
-
40
-
41
-
42
-
43
-
44
-
45
-
46
-
 47
47 -
 48
48 -
 49
49 -
 50
50 -
 51
51 -
 52
52 -
 53
53 -
 54
54 -
 55
55 -
 56
56 -
 57
57 -
 58
58 -
 59
59 -
 60
60 -
 61
61 -
 62
62 -
 63
63 -
 64
64 -
 65
65 -
 66
66 -
 67
67 -
68
-
69
-
70
-
71
-
72
-
73
-
74
-
75
-
76
-
77
-
78
-
79
-
80
-
81
-
82
-
83
-
84
-
85
-
86
-
87
-
88
-
89
-
90
-
91
-
92
-
93
-
94
-
95
-
96
-
97
-
98
-
99
-
100
-
101
-
102
-
103
-
104
-
105
-
106
-
107
-
108
-
109
-
110
-
111
-
112
-
113
-
114
-
115
-
116
-
117
-
118
-
119
-
120
-
121
-
122
-
123
-
124
-
125
-
126
-
127
-
128
-
129
-
130
-
131
-
132
-
133
-
134
-
135
-
136
-
137
-
138
-
139
-
140
-
141
-
142
-
143
-
144
-
145
-
146
-
147
-
148
-
149
-
150
-
151
-
152
-
153
-
154
-
155
-
156
-
157
-
158
-
159
-
160
-
161
-
162
-
163
-
164
-
165
-
166
-
167
-
168
-
169
-
170
-
171
-
172
-
173
-
174
-
175
-
176
-
177
-
178
-
179
-
180
-
181
-
182
-
183
-
184
-
185
-
186
-
187
-
188
-
189
-
190
-
191
-
192
-
193
-
194
-
195
-
196
-
197
-
198
-
199
-
200
-
201
-
202
-
203
-
204
-
205
-
206
-
207
-
208
 |
 |

57 COMBINED MANAGEMENT REPORT
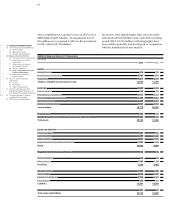
BMW Group value added statement
2013 2013 20121 20121 Change
in € million in % in € million in % in %
Work performed
Revenues 76,058 98.3 76,848 99.2
Financial income 455 0.6 – 263 – 0.3
Other income 841 1.1 829 1.1
Total output 77,354 100.0 77,414 100.0 – 0.1
Cost of materials2 42,692 55.2 41,304 53.3
Other expenses 8,402 10.9 9,194 11.9
Bought-in costs 51,094 66.1 50,498 65.2 1.2
Gross value added 26,260 33.9 26,916 34.8 – 2.4
Depreciation and amortisation 7,045 9.1 7,955 10.3
Net value added 19,215 24.8 18,961 24.5 1.3
Applied to
Employees 8,986 46.8 8,537 45.1 5.3
Providers of finance 1,794 9.3 2,030 10.7 – 11.6
Government / public sector 3,094 16.1 3,283 17.3 – 5.8
Shareholders 1,707 8.9 1,640 8.6 4.1
Group 3,608 18.8 3,445 18.2 4.7
Minority interest 26 0.1 26 0.1 –
Net value added 19,215 100.0 18,961 100.0 1.3
1 Prior year figures have been adjusted in accordance with the revised version of IAS 19, see note 7.
2 Cost of materials comprises all primary material costs incurred for vehicle production plus ancillary material costs (such as customs duties, insurance premiums and freight).
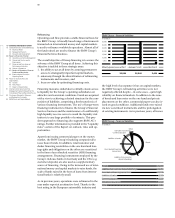
BMW Group value added 2013
in %
Net value added 24.8 Depreciation and amortisation 9.1
Cost of materials 55.2 Other expenses 10.9
Other expenses
Net value added
Cost of materials
Depreciation and amortisation 46.8 % Employees
9.3 % Providers of finance
16.1 % Government / public sector
8.9 % Shareholders
18.8 % Group
0.1 % Minority interest