BMW 2013 Annual Report Download - page 51
Download and view the complete annual report
Please find page 51 of the 2013 BMW annual report below. You can navigate through the pages in the report by either clicking on the pages listed below, or by using the keyword search tool below to find specific information within the annual report.-
 1
1 -
2
-
3
-
4
-
5
-
6
-
7
-
8
-
9
-
10
-
11
-
12
-
13
-
14
-
15
-
16
-
17
-
18
-
19
-
20
-
21
-
22
-
23
-
24
-
25
-
26
-
27
-
28
-
29
-
30
-
31
-
32
-
33
-
34
-
35
-
36
-
37
-
38
-
39
-
40
-
 41
41 -
 42
42 -
 43
43 -
 44
44 -
 45
45 -
 46
46 -
 47
47 -
 48
48 -
 49
49 -
 50
50 -
 51
51 -
 52
52 -
 53
53 -
 54
54 -
 55
55 -
 56
56 -
 57
57 -
 58
58 -
 59
59 -
 60
60 -
 61
61 -
62
-
63
-
64
-
65
-
66
-
67
-
68
-
69
-
70
-
71
-
72
-
73
-
74
-
75
-
76
-
77
-
78
-
79
-
80
-
81
-
82
-
83
-
84
-
85
-
86
-
87
-
88
-
89
-
90
-
91
-
92
-
93
-
94
-
95
-
96
-
97
-
98
-
99
-
100
-
101
-
102
-
103
-
104
-
105
-
106
-
107
-
108
-
109
-
110
-
111
-
112
-
113
-
114
-
115
-
116
-
117
-
118
-
119
-
120
-
121
-
122
-
123
-
124
-
125
-
126
-
127
-
128
-
129
-
130
-
131
-
132
-
133
-
134
-
135
-
136
-
137
-
138
-
139
-
140
-
141
-
142
-
143
-
144
-
145
-
146
-
147
-
148
-
149
-
150
-
151
-
152
-
153
-
154
-
155
-
156
-
157
-
158
-
159
-
160
-
161
-
162
-
163
-
164
-
165
-
166
-
167
-
168
-
169
-
170
-
171
-
172
-
173
-
174
-
175
-
176
-
177
-
178
-
179
-
180
-
181
-
182
-
183
-
184
-
185
-
186
-
187
-
188
-
189
-
190
-
191
-
192
-
193
-
194
-
195
-
196
-
197
-
198
-
199
-
200
-
201
-
202
-
203
-
204
-
205
-
206
-
207
-
208
 |
 |

51 COMBINED MANAGEMENT REPORT
The cash outflow for operating activities of the Finan-
cial Services segment is driven primarily by cash
flows relating to leased products and receivables from
sales financing and totalled € 5,358 million (2012:
€ 4,192 million). Investing activities resulted in a cash
rent other financial liabilities resulted in a cash inflow
of € 6,626 million (2012: € 7,427 million) and a cash out-
flow of € 4,996 million (2012: € 5,498 million). The net
cash outflow for current other financial liabilities was
€ 721 million (2012: net cash inflow of € 230 million). The
change in commercial paper gave rise to a net cash in-
flow of € 1,812 million (2012: net cash outflow of € 858 mil-
lion). By contrast, the payment of dividends resulted in a
cash outflow of € 1,653 million (2012: € 1,516 million).
The cash outflow for investing activities exceeded cash
inflow from operating activities in 2013 by € 3,367 mil-
lion, compared to a shortfall of € 357 million in the pre-
vious year.
After adjusting for the effects of exchange-rate fluctu-
ations
and changes in the composition of the BMW
inflow of € 324 million (2012: cash outflow of € 32 mil-
lion).
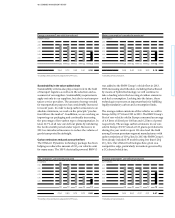
Net financial assets of the Automotive segment com-
prise the following:
Group with a total negative amount of € 42 million
(2012: negative amount of € 1 million), the various cash
flows resulted in a decrease of cash and cash equiva-
lents of € 706 million (2012: increase of € 594 million).
The cash flow statement for the Automotive segment
shows that the cash inflow from operating activities
exceeded the cash outflow for investing activities by
€ 1,962 million (2012: € 3,637 million). Adjusted for net
investments in marketable securities amounting to
€ 537 million (2012: € 172 million), mainly in conjunction
with strategic liquidity planning, the excess amount
was € 2,499 million (2012: € 3,809 million).
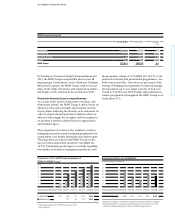
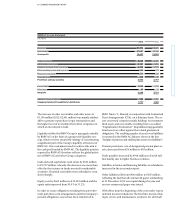
Free cash flow of the Automotive segment can be ana-
lysed
as follows:
in € million 31. 12. 2013 31. 12. 2012
Cash inflow from operating activities 9,450 9,167
Cash outflow for investing activities – 7,488 – 5,530
Net investment in marketable securities 537 172
Free cash flow Automotive segment 2,499 3,809
in € million 31. 12. 2013 31. 12. 2012
Cash and cash equivalents 6,768 7,484
Marketable securities and investment funds 2,758 2,205
Intragroup net financial receivables 4,460 5,862
Financial assets 13,986 15,551
Less: external financial liabilities* – 1,859 – 2,224
Net financial assets 12,127 13,327
* Excluding derivative financial instruments.