BMW 2013 Annual Report Download - page 164
Download and view the complete annual report
Please find page 164 of the 2013 BMW annual report below. You can navigate through the pages in the report by either clicking on the pages listed below, or by using the keyword search tool below to find specific information within the annual report.-
 1
1 -
2
-
3
-
4
-
5
-
6
-
7
-
8
-
9
-
10
-
11
-
12
-
13
-
14
-
15
-
16
-
17
-
18
-
19
-
20
-
21
-
22
-
23
-
24
-
25
-
26
-
27
-
28
-
29
-
30
-
31
-
32
-
33
-
34
-
35
-
36
-
37
-
38
-
39
-
40
-
41
-
42
-
43
-
44
-
45
-
46
-
47
-
48
-
49
-
50
-
51
-
52
-
53
-
54
-
55
-
56
-
57
-
58
-
59
-
60
-
61
-
62
-
63
-
64
-
65
-
66
-
67
-
68
-
69
-
70
-
71
-
72
-
73
-
74
-
75
-
76
-
77
-
78
-
79
-
80
-
81
-
82
-
83
-
84
-
85
-
86
-
87
-
88
-
89
-
90
-
91
-
92
-
93
-
94
-
95
-
96
-
97
-
98
-
99
-
100
-
101
-
102
-
103
-
104
-
105
-
106
-
107
-
108
-
109
-
110
-
111
-
112
-
113
-
114
-
115
-
116
-
117
-
118
-
119
-
120
-
121
-
122
-
123
-
124
-
125
-
126
-
127
-
128
-
129
-
130
-
131
-
132
-
133
-
134
-
135
-
136
-
137
-
138
-
139
-
140
-
141
-
142
-
143
-
144
-
145
-
146
-
147
-
148
-
149
-
150
-
151
-
152
-
153
-
 154
154 -
 155
155 -
 156
156 -
 157
157 -
 158
158 -
 159
159 -
 160
160 -
 161
161 -
 162
162 -
 163
163 -
 164
164 -
 165
165 -
 166
166 -
 167
167 -
 168
168 -
 169
169 -
 170
170 -
 171
171 -
 172
172 -
 173
173 -
 174
174 -
175
-
176
-
177
-
178
-
179
-
180
-
181
-
182
-
183
-
184
-
185
-
186
-
187
-
188
-
189
-
190
-
191
-
192
-
193
-
194
-
195
-
196
-
197
-
198
-
199
-
200
-
201
-
202
-
203
-
204
-
205
-
206
-
207
-
208
 |
 |

164
88 GROUP FINANCIAL STATEMENTS
88 Income Statements
88 Statement of
Comprehensive Income
90 Balance Sheets
92 Cash Flow Statements
94 Group Statement of Changes in
Equity
96 Notes
96 Accounting Principles and
Policies
114 Notes to the Income Statement
121 Notes to the Statement
of Comprehensive Income
122
Notes to the Balance Sheet
145 Other Disclosures
161 Segment Information
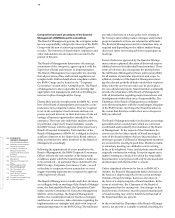
in € million 2013 2012*
Reconciliation of segment result
Total for reportable segments 8,539 9,172
Financial result of Automotive segment and Motorcycles segment – 99 – 432
Elimination of inter-segment items – 527 – 937
Group profit before tax 7,913 7,803
Reconciliation of capital expenditure on non-current assets
Total for reportable segments 24,204 21,438
Elimination of inter-segment items – 4,325 – 2,901
Total Group capital expenditure on non-current assets 19,879 18,537
Reconciliation of depreciation and amortisation on non-current assets
Total for reportable segments 10,741 9,618
Elimination of inter-segment items – 3,787 – 1,838
Total Group depreciation and amortisation on non-current assets 6,954 7,780
in € million 31. 12. 2013 31. 12 . 2 0 12*
Reconciliation of segment assets
Total for reportable segments 73,410 69,714
Non-operating assets – Other Entities segment 5,989 6,065
Operating liabilities – Financial Services segment 83,923 81,064
Interest-bearing assets – Automotive and Motorcycles segments 37,364 36,321
Liabilities of Automotive and Motorcycles segments not subject to interest 24,411 21,943
Elimination of inter-segment items – 86,729 – 83,272
Total Group assets 138,368 131,835
* Prior year figures have been adjusted in accordance with the revised version of IAS 19, see note 7.
The segment result of the Motorcycles segment in the
previous year was negatively impacted by an impair-
ment loss of € 13 million on property, plant and equip-
ment in accordance with IFRS 5 and by an expense of
€ 57 million for an allocation to provisions at 31 Decem-
ber 2012.
Interest and similar income of the Financial Services
segment is included in segment result and totalled
€ 5 million (2012*: € 1 million). Interest and similar
ex-
penses of the Financial Services segment amounted
to
€ 7 million (2012*: € 5 million). Financial Services
segment result was negatively impacted by impair-
ment losses totalling € 139 million recognised on
leased products.
The Other Entities segment result includes interest
and
similar income amounting to € 1,340 million (2012*:
€ 1,542 million) and interest and similar expenses
amounting to € 1,279 million (2012*: € 1,499 million). As
in the previous year, the result from equity accounted
investments did not have any impact on the segment
result of the Other Entities segment. The segment result
is stated after an impairment loss on other investments
amounting to € 7 million (2012: € 7 million).
As in the previous year, segment assets of the Other
Entities segment do not contain any investments ac-
counted
for using the equity method.
The information disclosed for capital expenditure and
depreciation and amortisation relates to non-current
property, plant and equipment, intangible assets and
leased products.
Segment figures can be reconciled to the corresponding
Group figures as follows: