BMW 2013 Annual Report Download - page 150
Download and view the complete annual report
Please find page 150 of the 2013 BMW annual report below. You can navigate through the pages in the report by either clicking on the pages listed below, or by using the keyword search tool below to find specific information within the annual report.-
 1
1 -
2
-
3
-
4
-
5
-
6
-
7
-
8
-
9
-
10
-
11
-
12
-
13
-
14
-
15
-
16
-
17
-
18
-
19
-
20
-
21
-
22
-
23
-
24
-
25
-
26
-
27
-
28
-
29
-
30
-
31
-
32
-
33
-
34
-
35
-
36
-
37
-
38
-
39
-
40
-
41
-
42
-
43
-
44
-
45
-
46
-
47
-
48
-
49
-
50
-
51
-
52
-
53
-
54
-
55
-
56
-
57
-
58
-
59
-
60
-
61
-
62
-
63
-
64
-
65
-
66
-
67
-
68
-
69
-
70
-
71
-
72
-
73
-
74
-
75
-
76
-
77
-
78
-
79
-
80
-
81
-
82
-
83
-
84
-
85
-
86
-
87
-
88
-
89
-
90
-
91
-
92
-
93
-
94
-
95
-
96
-
97
-
98
-
99
-
100
-
101
-
102
-
103
-
104
-
105
-
106
-
107
-
108
-
109
-
110
-
111
-
112
-
113
-
114
-
115
-
116
-
117
-
118
-
119
-
120
-
121
-
122
-
123
-
124
-
125
-
126
-
127
-
128
-
129
-
130
-
131
-
132
-
133
-
134
-
135
-
136
-
137
-
138
-
139
-
 140
140 -
 141
141 -
 142
142 -
 143
143 -
 144
144 -
 145
145 -
 146
146 -
 147
147 -
 148
148 -
 149
149 -
 150
150 -
 151
151 -
 152
152 -
 153
153 -
 154
154 -
 155
155 -
 156
156 -
 157
157 -
 158
158 -
 159
159 -
 160
160 -
161
-
162
-
163
-
164
-
165
-
166
-
167
-
168
-
169
-
170
-
171
-
172
-
173
-
174
-
175
-
176
-
177
-
178
-
179
-
180
-
181
-
182
-
183
-
184
-
185
-
186
-
187
-
188
-
189
-
190
-
191
-
192
-
193
-
194
-
195
-
196
-
197
-
198
-
199
-
200
-
201
-
202
-
203
-
204
-
205
-
206
-
207
-
208
 |
 |

150
88 GROUP FINANCIAL STATEMENTS
88 Income Statements
88 Statement of
Comprehensive Income
90 Balance Sheets
92 Cash Flow Statements
94 Group Statement of Changes in
Equity
96 Notes
96 Accounting Principles and
Policies
114 Notes to the Income Statement
121 Notes to the Statement
of Comprehensive Income
122
Notes to the Balance Sheet
145 Other Disclosures
161 Segment Information
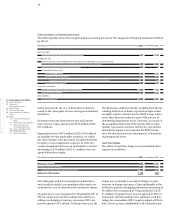
Fair value measurement of financial instruments
The fair values shown are computed using market in-
formation
available at the balance sheet date, on the
basis of prices quoted by the contract partners or using
appropriate measurement methods, e. g. discounted cash
flow models. In the latter case, amounts were discounted
at 31 December 2013 on the basis of the following
in-
terest rates:
Interest rates taken from interest rate curves were ad-
justed,
where necessary, to take account of the credit
quality and risk of the underlying financial instrument.
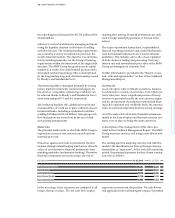
Derivative financial instruments are measured at their
fair value. The fair values of derivative financial instru-
ments
are determined using measurement models, as
a consequence of which there is a risk that the amounts
calculated could differ from realisable market prices on
disposal. Observable financial market price spreads
are taken into account in the measurement of derivative
financial instruments. The methodology for collating
data used in the fair values computation model was re-
fined during the second quarter of 2013, particularly
with respect to the way interest rate curves are employed
and the use of additional market data (tenor and cur-
rency basis spreads), thus helping to minimise differ-
ences between the carrying amounts of the instruments
and the amounts that can be realised on the financial
markets on their disposal. In addition, the Group’s own
default risk and that of counterparties is taken into
account in the form of credit default swap (CDS) con-
tracts
which have matching terms and which can be
observed on the market.
Financial instruments measured at fair value are allo-
cated to different measurement levels in accordance with
IFRS 13. This includes financial instruments that are
1.
measured at their fair values in an active market for
identical financial instruments (Level 1),
2. measured at their fair values in an active market for
comparable financial instruments or using measure-
ment models whose main input factors are based on
observable market data (Level 2) or
3. using input factors not based on observable market
data (Level 3).
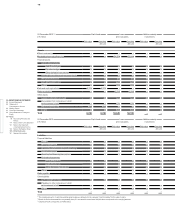
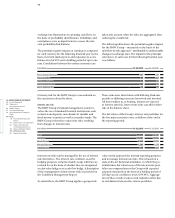
The following table shows the amounts allocated to
each measurement level at the end of the reporting
period:
31 December 2013 Level hierarchy in accordance with IFRS 13
in € million Level 1 Level 2 Level 3
Marketable securities, investment fund shares and collateral assets – available-for-sale 3,134 – –
Other investments – available-for-sale 379 – –
Derivative instruments (assets)
Cash flow hedges – 1,914 –
Fair value hedges – 1,050 –
Other derivative instruments – 1,049 –
Derivative instruments (liabilities)
Cash flow hedges – 317 –
Fair value hedges – 321 –
Other derivative instruments – 465 –
ISO Code EUR USD GBP JPY CNY
in %
Interest rate for six months 0.28 0.26 0.54 0.20 5.66
Interest rate for one year 0.40 0.31 0.71 0.21 5.80
Interest rate for five years 1.27 1.77 2.17 0.40 5.80
Interest rate for ten years 2.22 3.17 3.09 0.95 5.86