BMW 2013 Annual Report Download - page 56
Download and view the complete annual report
Please find page 56 of the 2013 BMW annual report below. You can navigate through the pages in the report by either clicking on the pages listed below, or by using the keyword search tool below to find specific information within the annual report.-
 1
1 -
2
-
3
-
4
-
5
-
6
-
7
-
8
-
9
-
10
-
11
-
12
-
13
-
14
-
15
-
16
-
17
-
18
-
19
-
20
-
21
-
22
-
23
-
24
-
25
-
26
-
27
-
28
-
29
-
30
-
31
-
32
-
33
-
34
-
35
-
36
-
37
-
38
-
39
-
40
-
41
-
42
-
43
-
44
-
45
-
 46
46 -
 47
47 -
 48
48 -
 49
49 -
 50
50 -
 51
51 -
 52
52 -
 53
53 -
 54
54 -
 55
55 -
 56
56 -
 57
57 -
 58
58 -
 59
59 -
 60
60 -
 61
61 -
 62
62 -
 63
63 -
 64
64 -
 65
65 -
 66
66 -
67
-
68
-
69
-
70
-
71
-
72
-
73
-
74
-
75
-
76
-
77
-
78
-
79
-
80
-
81
-
82
-
83
-
84
-
85
-
86
-
87
-
88
-
89
-
90
-
91
-
92
-
93
-
94
-
95
-
96
-
97
-
98
-
99
-
100
-
101
-
102
-
103
-
104
-
105
-
106
-
107
-
108
-
109
-
110
-
111
-
112
-
113
-
114
-
115
-
116
-
117
-
118
-
119
-
120
-
121
-
122
-
123
-
124
-
125
-
126
-
127
-
128
-
129
-
130
-
131
-
132
-
133
-
134
-
135
-
136
-
137
-
138
-
139
-
140
-
141
-
142
-
143
-
144
-
145
-
146
-
147
-
148
-
149
-
150
-
151
-
152
-
153
-
154
-
155
-
156
-
157
-
158
-
159
-
160
-
161
-
162
-
163
-
164
-
165
-
166
-
167
-
168
-
169
-
170
-
171
-
172
-
173
-
174
-
175
-
176
-
177
-
178
-
179
-
180
-
181
-
182
-
183
-
184
-
185
-
186
-
187
-
188
-
189
-
190
-
191
-
192
-
193
-
194
-
195
-
196
-
197
-
198
-
199
-
200
-
201
-
202
-
203
-
204
-
205
-
206
-
207
-
208
 |
 |

56
18 COMBINED MANAGEMENT REPORT
18
General Information on the BMW Group
18 Business Model
20 Management System
23 Research and Development
24 Report on Economic Position
24 Overall Assessment by Management
24 General and Sector-specific
Environment
27
Financial and Non-financial
Performance Indicators
29 Review of Operations
47 Results of Operations, Financial
Position and Net Assets
62 Events after the End of the
Reporting Period
63 Report on Outlook, Risks and
Opportunities
63 Outlook
68 Risks Report
77 Report on Opportunities
81 Internal Control System and Risk
Management System Relevant for
the
Consolidated Financial Reporting Process
82 Disclosures Relevant for Takeovers
and Explanatory Comments
85
BMW Stock and Capital Markets
exchange rate factors, both non-current financial liabili-
ties and current financial liabilities increased by 4.4 %.
Overall, the earnings performance, financial position
and net assets position of the BMW Group continued to
develop very positively during the financial year under
report.
Compensation report
The compensation of the Board of Management com-
prises both a fixed and a variable component. Benefits
are also payable – primarily in the form of pension
benefits – at the end of members’ mandates. Further
details, including an analysis of remuneration by each
individual, are disclosed in the Compensation Report,
which can be found in the section “Statement on Cor-
porate Governance”. The Compensation Report is a sub-
section of the Combined Management Report.
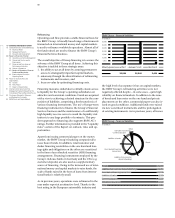
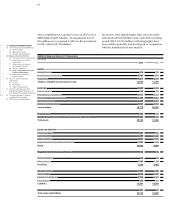
Value added statement*
The value added statement shows the value of work
performed less the value of work bought in by the BMW
Group during the financial year. Depreciation and
amortisation, cost of materials and other expenses are
treated as bought-in costs in the value added calcula-
tion. The allocation statement applies value added to
each of the participants involved in the value added
process. It should be noted that the gross value added
amount treats depreciation as a component of value
added which, in the allocation statement, is treated as
internal financing.
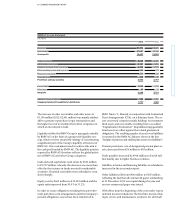
Net valued added by the BMW Group in 2013 increased
by 1.3 % to € 19,215 million and was once again at a high
level.
The bulk of the net value added (46.8 %) is applied to
employees. The proportion applied to providers of finance
fell to 9.3 %, mainly due to the lower refinancing costs
on international capital markets for the financial services
side of the business. The government / public sector (in-
cluding deferred tax expense) accounted for 16.1 %. The
proportion of net value added applied to shareholders,
at 8.9 %, was higher than in the previous year. Minority
interests take a 0.1 % share of net value added. The
re-
maining portion of net value added (18.8%) will be
re-
tained in the Group to finance future operations.
* Prior year figures have been adjusted in accordance with the revised version of
IAS 19, see note 7.